We know indicators are useless for market timing in day trading. What to do?
We know we can’t predict the market direction – the markets are random.
However, there is one sure thing there. Namely, prices always move from an extreme in one direction to the next in the opposite one. You can spot these zigzags in every market.
Why do markets behave like this? Because nobody knows what the “right” price is.
For example, as long as there are more buyers than sellers, the price will go up. Then, at some point, the price becomes too high and demand dries up. So, the price forms a top and then goes down. And then up – and the process continues indefinitely.
This is just how the markets work – the price discovery mechanism.
We created an algorithm that can nail these market turns in real-time. We call it Pivot Points Analyzer (or PPA, for short).
Pivot Points Analyzer – how it works
Our algorithm scans the price action in real-time looking for specific patterns, and matches them against the big picture. This way we can generate only the most relevant signals.
Can our algorithm predict the future? Of course, not.
But the keyword here is “real-time”. The algorithm works fast enough to give you a competitive advantage over many other market participants. In particular, manual traders relying on lagging indicators.
Let us zoom in deeper in our example of RSI-based market entry: the screnshot below shows the signal generated by our algorithm. Note that it was just 2 pips shy of the maximum price of the whole session.
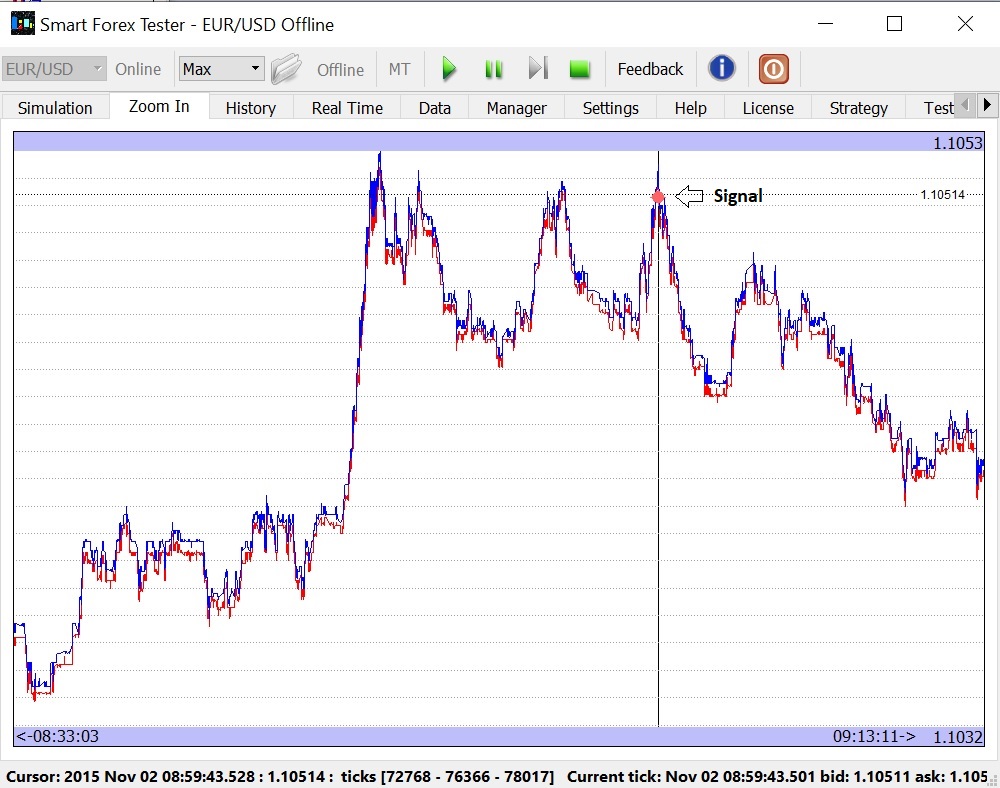
Now, let us zoom in even more – using our inbuilt trade analyzer.
The screenshot below now only show 14 s around the very top. You can clearly see the bid (red) and ask (blue) lines. A chaotic graph like this is what you see when you are trading. In addition, it is fast-changing: you can have new prices coming many times each second!
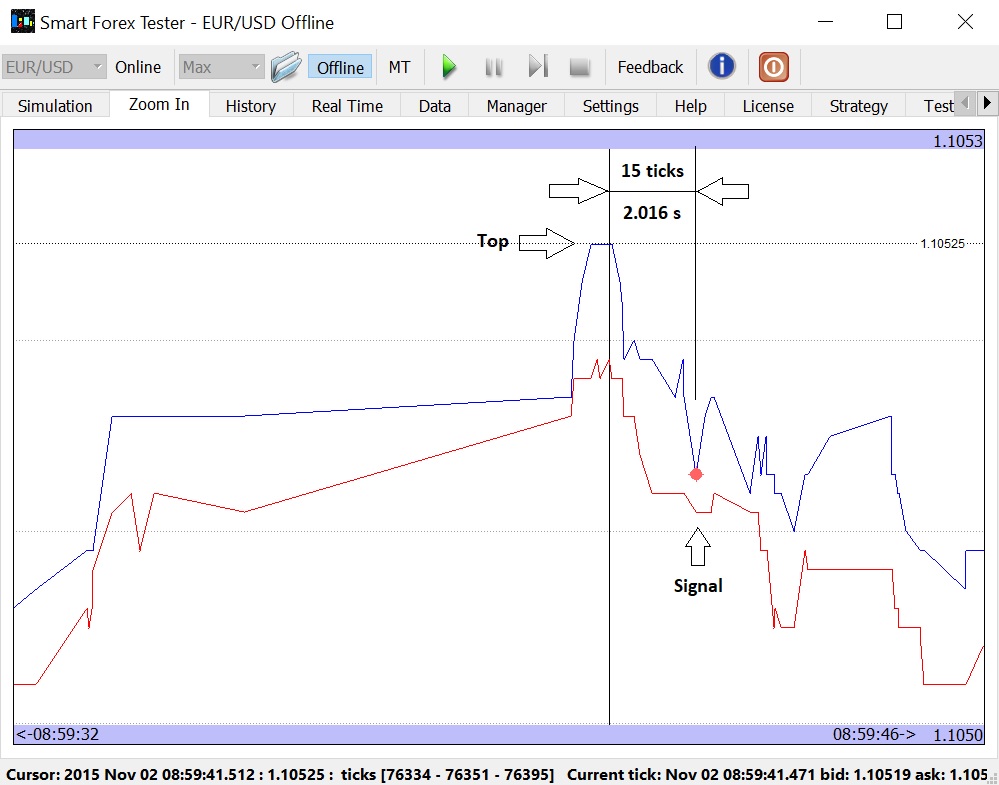
We can see the top we marked on the graph only lasted about 300 ms and during this time there were 4 ticks.
You may notice that our algorithm fired a signal just 15 ticks after the top (check the cursor position on both graphs) – within a mere 2 seconds!
Just think of it.
Imagine you were trading manually and staring at your terminal all this time without a blink. Looking at this messy fast-changing chart, not only did you need to make a decision, but also place an order. Could you do it in 2 seconds?
But the software could open a position on the same tick the signal was generated.
Under the hood (from passion to solution)
How did we come to the Pivot Points Analyzer idea?
We’ve tested multiple approaches – to no avail. First of all, we used different indicators and their combinations for market timing. But test after test after test failed.
It took us quite a while until we realized that we can try to treat the market price action as a signal, as we noticed there are clear similarities between them.
Turns out, signal processing happened to be our passion for many years. And we’ve gained a lot of experience there.
So, it didn’t take us long to decide that we should attempt to apply our skills to develop an algorithm that would signal the moments when price reversals happen.
The problem is, there is a lot of price swings all the time. To be of any use, the algorithm should be able to discard all the noise from the price action and only signal when a major reversal happens.
Suddenly our expertise in signal recognition from the background noises came really handy.
But still, it took us several years of researching the internal structure of the price “signal” to find the reversal signs, and develop the algorithm and software to make use of them – both in manual and automated trading.
Note that our algorithm doesn’t try to predict anything. Nor does it any approximation – you just can’t approximate the reversal.
But the principal importance of the algorithm is that it is able to signal the price extremes very fast. Which simply means you can front-run the crowd and have time to enter or exit the market before them.
That was really exciting.
But another discovery we made was even more amazing. We noticed the algorithm’s behavior in trending markets becomes different.
Look at the below example.
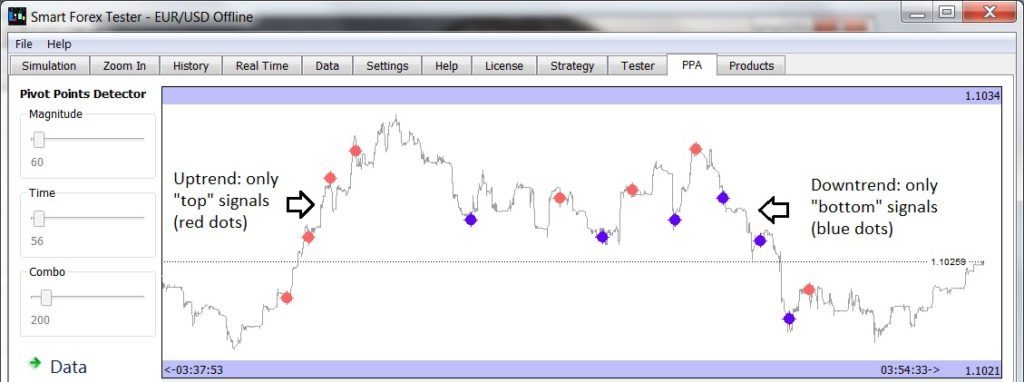
When the market starts trending, the algorithm only detects extremes in the trend direction! On the picture, compare the small trends (marked by arrows) with the flat market in the middle.
Turns out, this is no coincidence. The patterns that our algorithm detects from the price action, are just not present in the counter-trend moves.
This is very powerful knowledge: we can use it as a trend indicator. Which works with a minimum lag – if the algorithm sensitivity is set to high (as it is on the picture). Note small time difference between the signals on the tick graph above which spans less than 20 minutes.
Moreover, real-time Pivot Points Analyzer signals fit very well to automated trading – especially for trend following. You can check out how our PPA-based trend following strategy bagged 150 pips in 5 minutes.
Finally, note that this strategy works well also for news trading. Quite often, major announcements like rate decisions result in powerful market swings up and down within minutes.