Free access to high-quality real-time Forex prices is an important feature of Day Trading Tester. You can forward test on 10 main currency pairs provided by TrueFX.com via their WebAPI. In addition, you can save the price data for the pair you test on – to back test later.
Now, we added the Quote Saver which enables you to simultaneously record the price quotes for all the 10 currency pairs. It is especially convenient if you use our Batch Tester. You can record the latest price data during a trading week, and then test on all saved data in one go.
Another big advantage of the Quote Saver is that you can get latest price data. To download free tick data for the same time period from TrueFX.com, you will need to wait until the end of the month, since they only provide monthly files.
Quote Saver is free– but keep in mind that if you don’t have a premium license installed, you need to use the Online Simulator license.
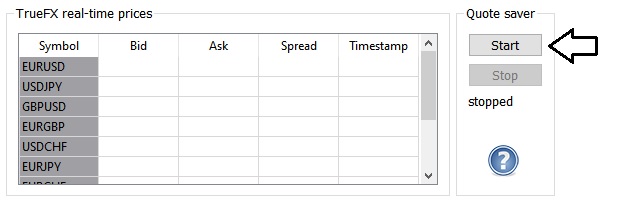
Quote Saver is very easyto use. Make sure the Forex market is open. Start the software. Click the Online button on the Toolbar. Then click the Start button on the Real time tab:
To begin recording, click Online on the Toolbar then click the Quote Saver Start button
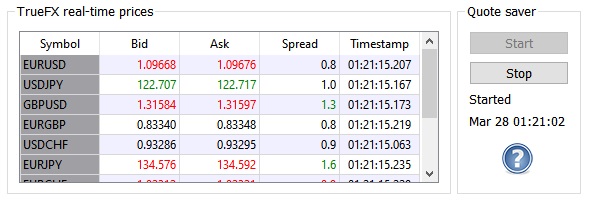
A dialog window will pop up asking you to select the folder where to save the price quotes. Select a folder and click OK – the recording will start:
Quote Saver is running – click the Stop button to end recording
Make sure you have the rights to write in the selected directory. If a folder is write-protected, Quote Saver might not throw an error.
You can end recording at any time by clicking the Stop button.
Quote Saver writes the price quotes as 10 separate .csv files with names matching the currency pairs (e.g. EURJPY.csv).
Remember to move your previously recorded data from the folder you select fro saving. Quote Saver will rewrite the files in the folder without warning.
NOTE: When the Quote Saver is running, other products of the Suite are unavailable. However, during recording you can access the data being saved and use it to test on another computer.
Check out an example of the Forex tick by tick data that we collected with Quote Saver during entire trading week of March 20-25, 2022 .
Last month we published our new version2 trading strategy and also shared the test results for modified version2. Which were slightly better.
Now, we have made some more improvements to vesion2 and we decided to release them as our next version3. It is available now in the latest software.
Version3 main difference from its predecessor is that one of the 2 entry/exit conditions is made less restrictive, so that it works faster. Which was found beneficial in our testing.
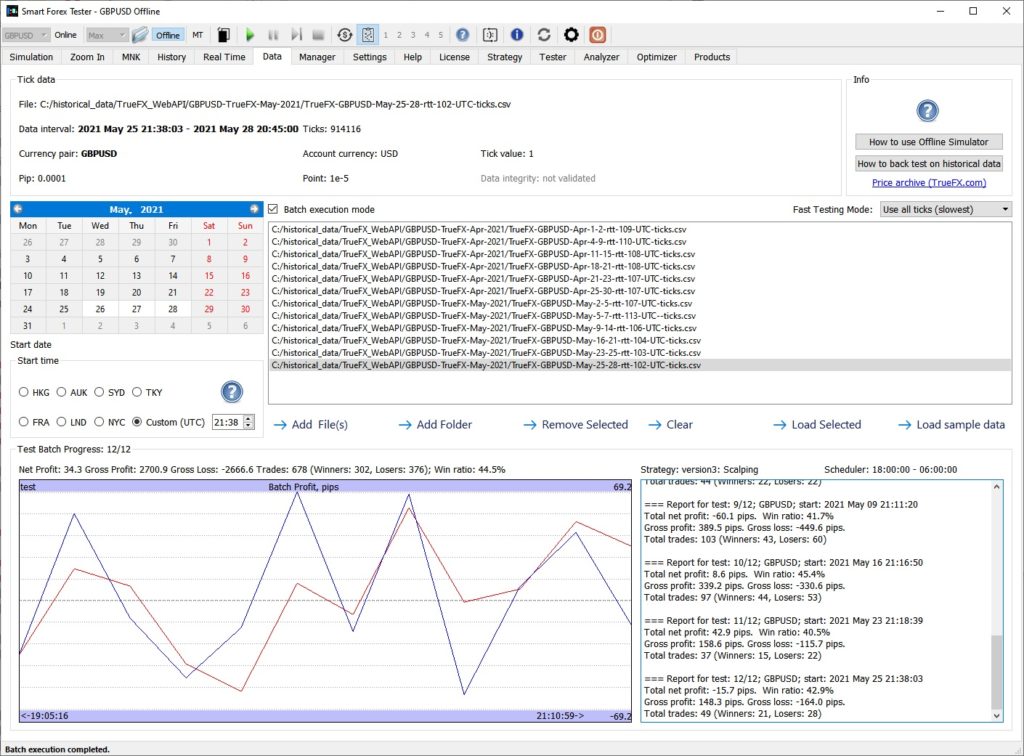
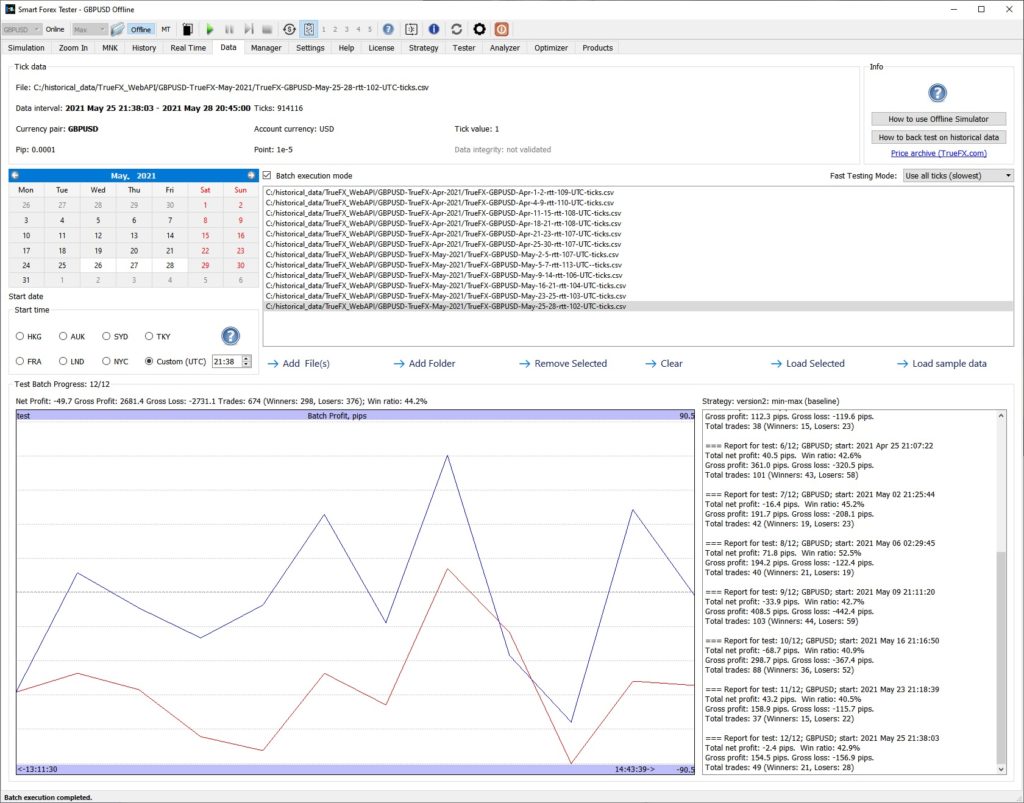
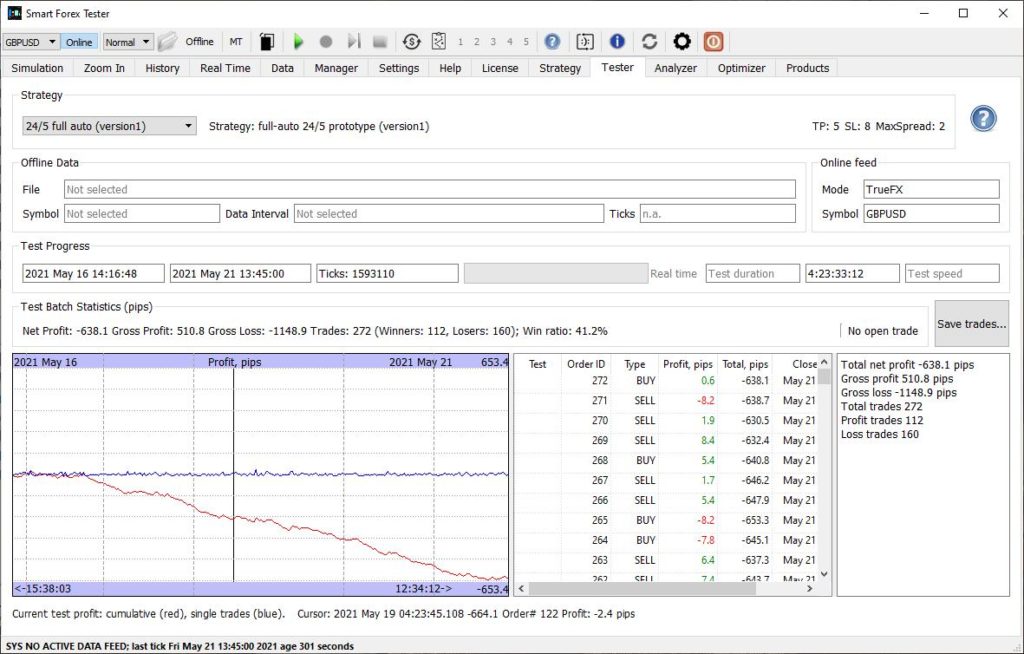
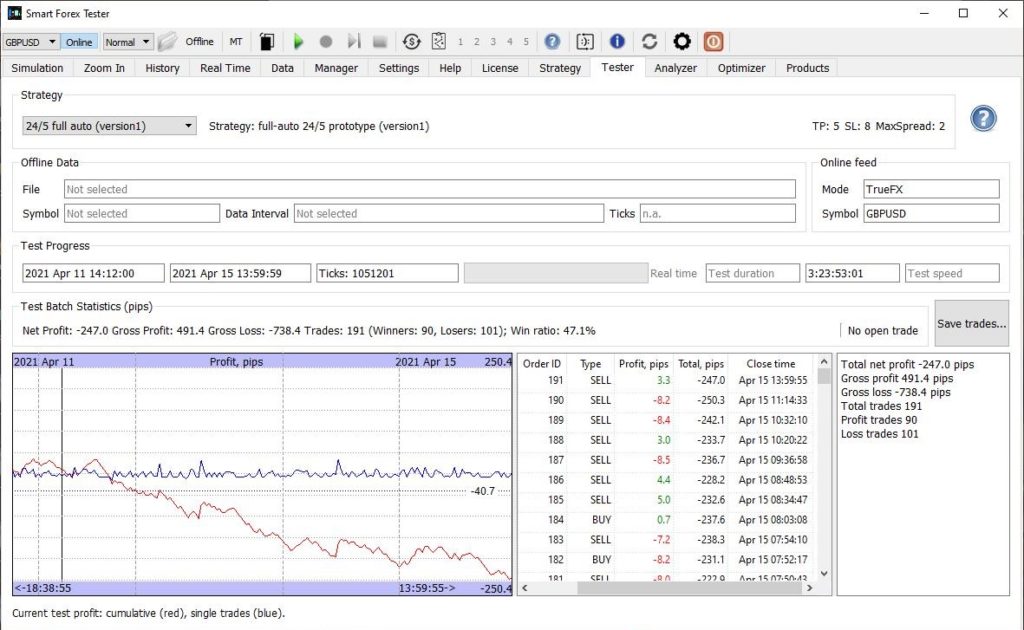
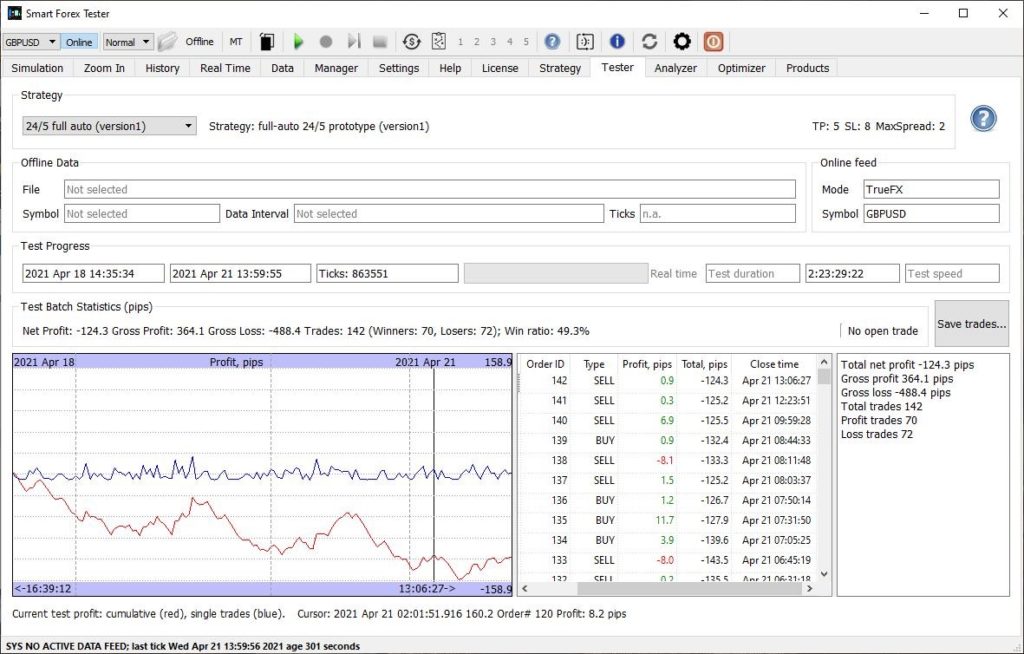
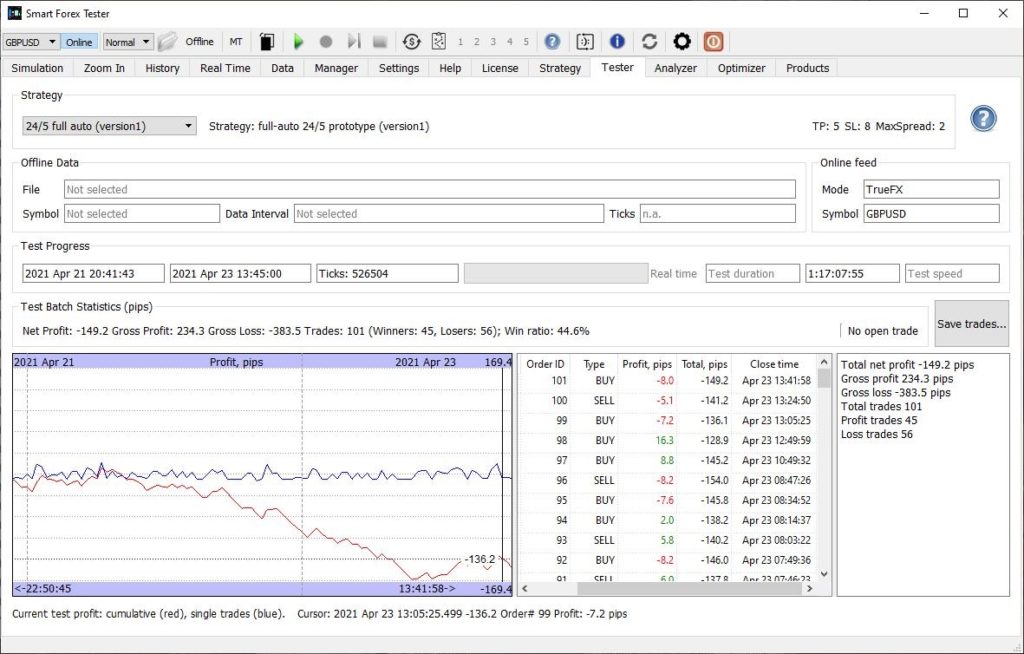
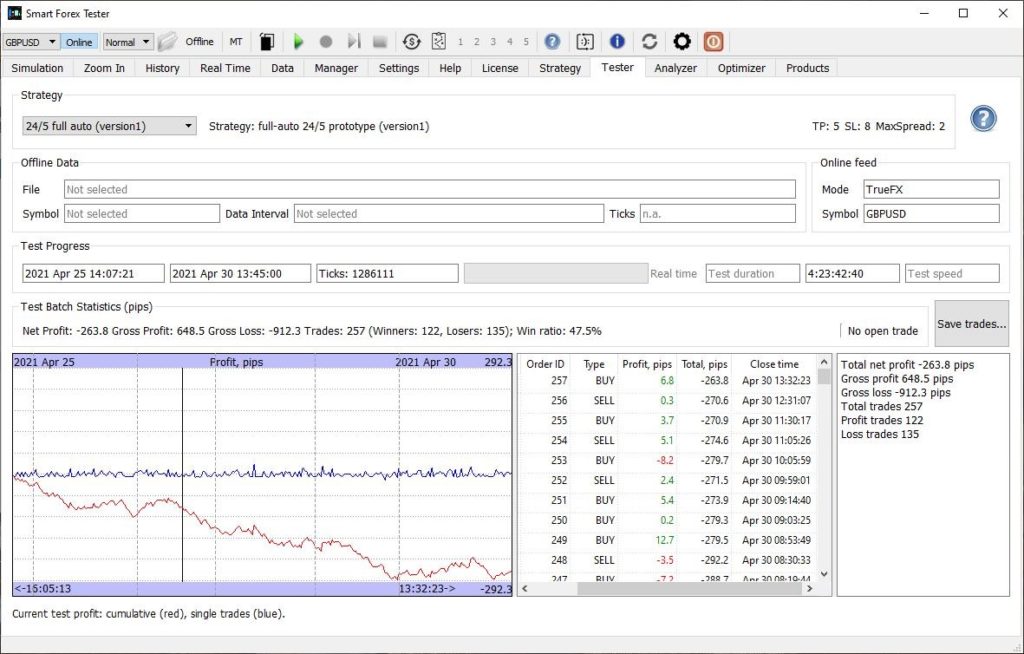
To compare the new trading strategy with the previous versions, we ran our standard April-May 2021 GBPUSD 06.00-18.00 UTC test. Version3 turned out to be the best out of the 3, and it was also profitable in this test.
Unlike version1 and 3, version3 turns profit in April-May 2021 GBPUSD test
You may say that the result is nothing to write home about. While we would agree in general, still it is important to notice much better draw-down pattern than that for version2 (which also lost about 50 pips). And version3 is light years ahead of version1 that lost hundreds of pips in this test.
Version3 does not yet fix the “blind spot” issue we observed in version2. If you check the details in the trades log, you will find about 10 trades that lost the entire stop-loss (we set it to 60 pips). To say nothing of multiple trades with smaller but still sizeable losses that were closed by the scheduler before they had time to hit the full stop-loss level.
As we showed in the post about version2, in many of these cases losses could be cut by at least half by manually closing the positions. Do the math.
Due to the issue, it makes little sense to bulk test the strategy in the full-auto mode: the results will be dependent on the number of position locks. But even with the issue we see the potential in version3, so we continue to work on it.
What is a blind spot? It is a code logic error. It is very easy to fix. That said, every fix we tried worked worse in our tests than the code without a fix. The reason is as follows.
Most often blind spots happen when a powerful trend starts in the direction opposite to the open position and then the position most probably either hit the stop-loss or will be closed by the Scheduler.
One possible solution would be to accept the error and close the position immediately when a blind spot is detected; and forbid new orders until the market hit the stop-loss level of the closed position. If we could do that, we could have cut hundreds of pips of losses.
The problem with this approach is that sometimes, when the markets fluctuate without clear direction, a blind spot might also occur – and it may go away on its own and then our positioning will eventually prove correct. But if we close the position in this case, we would lose a lot of potential profit as well.
So, better approach for the automated strategy would be to try to recognize a powerful trend and reverse the position. In this case we could count on profiting more from correct positioning than losing from wrong decisions.
While we are working on the improvements, we decided to add controls to help using this trading strategy in semi-automated mode.
When the issue occurs, we print the warning, and we also draw a horizontal line at the lock level. If the open position is a BUY, the blind spot won’t dissipate on its own as long as the market stays below the black line. For a SELL position – above the line.
We might also add a sound indication later, if deemed necessary. Let us know.
In the most important cases you can easily tell when a new powerful trend started. So, you can make corrections immediately.
What to do. First of all, disable automated trading in the direction of the currently open position. Use the checkboxes on the Simulation tab. For example, if you have a long position, uncheck the Allow BUY box. This is needed as a precaution measure, because when you close the position, the automated strategy can open a new one without any warning.
Next, monitor the market and wait for a good time to close the open position manually with minimum losses. If you succeed to catch a convenient pullback, you can manually open the opposite position immediately after.
Now, when you are positioned properly, keep in mind that the position is monitored by the automated strategy. Which may close it when the exit condition is met.
If you are actively monitoring the situation, depending on your priorities, you can manually override the strategy again: if you uncheck the Allow CLOSE box, your order will be active until you close it yourself (or check the box back).
Sounds complicated? Try it in the offline simulator. Start any test at full speed from the Tester tab, and when you hit a blind spot, reduce the tick feed speed to 4X (or 2X, depending on the market action). You will quickly understand that the procedure we described is actually pretty straightforward.
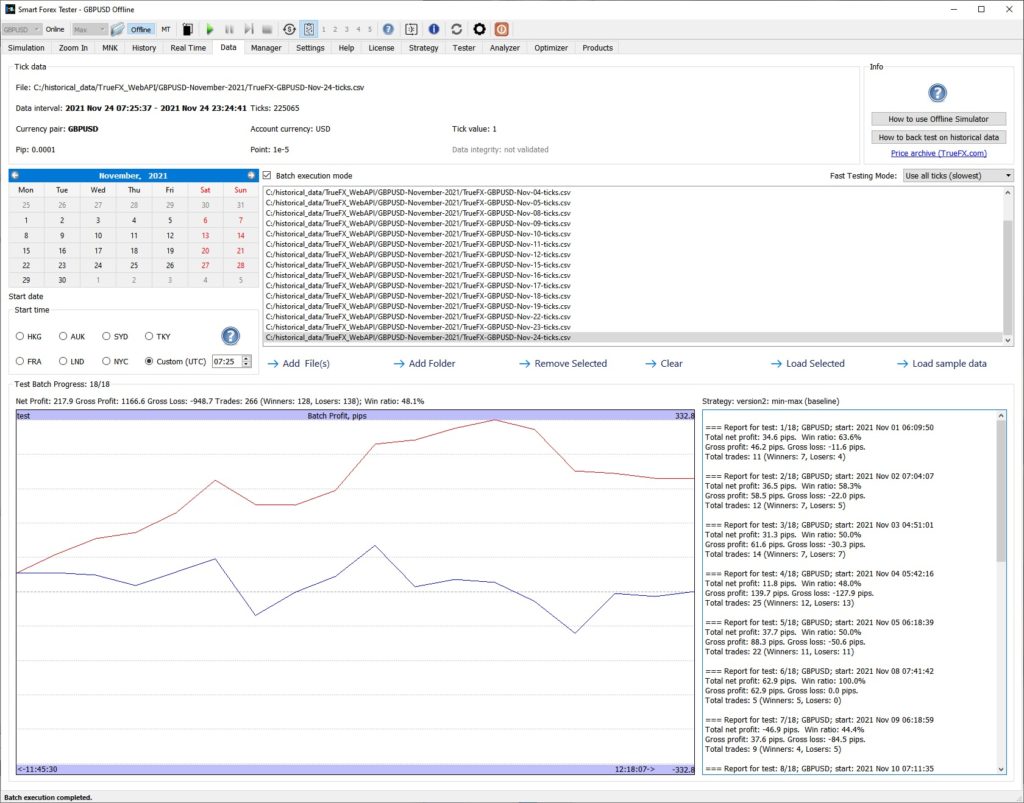
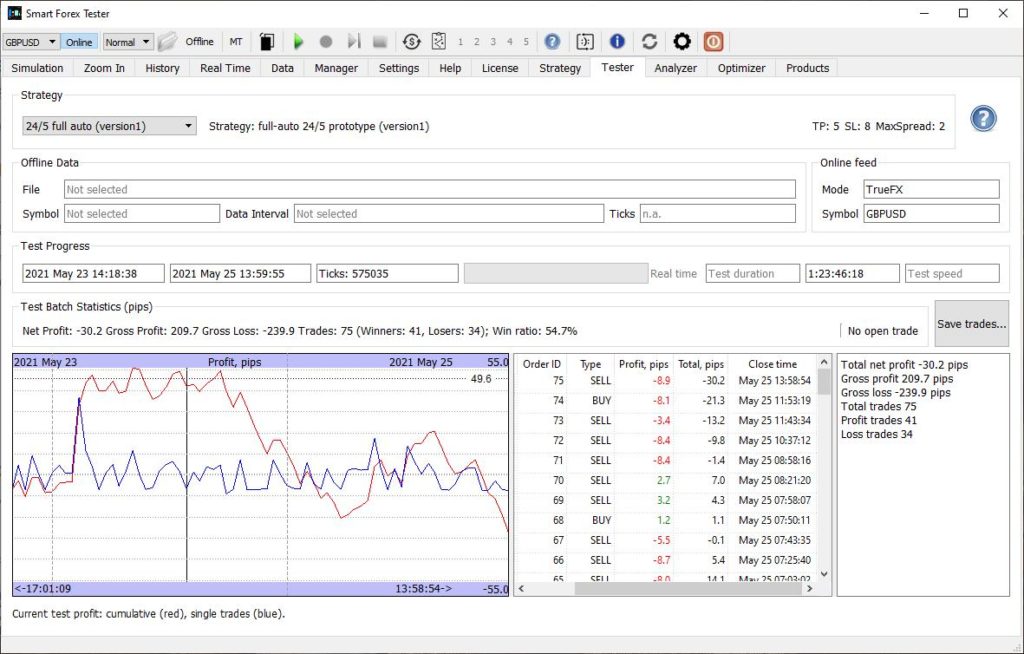
We made a slight modification to the baseline strategy and the result was 50% better than the one we posted for the baseline version. The modified version scored 220 pips vs 144 pips for the baseline – with zero absolutedraw down.
A modification to the version2 strategy delivered 50% better result than the baseline
The data set used was the same as in the previous test, except that we added 3 more days (11/22-24). But these extra days didn’t change the main result – see the horizontal part on the right hand side of the graph. Which was kind of expected during the holiday week. The market was basically threading water.
You see the same November 19 “blind spot” as for the baseline. If you want to compare with the baseline test, here is the trade log.
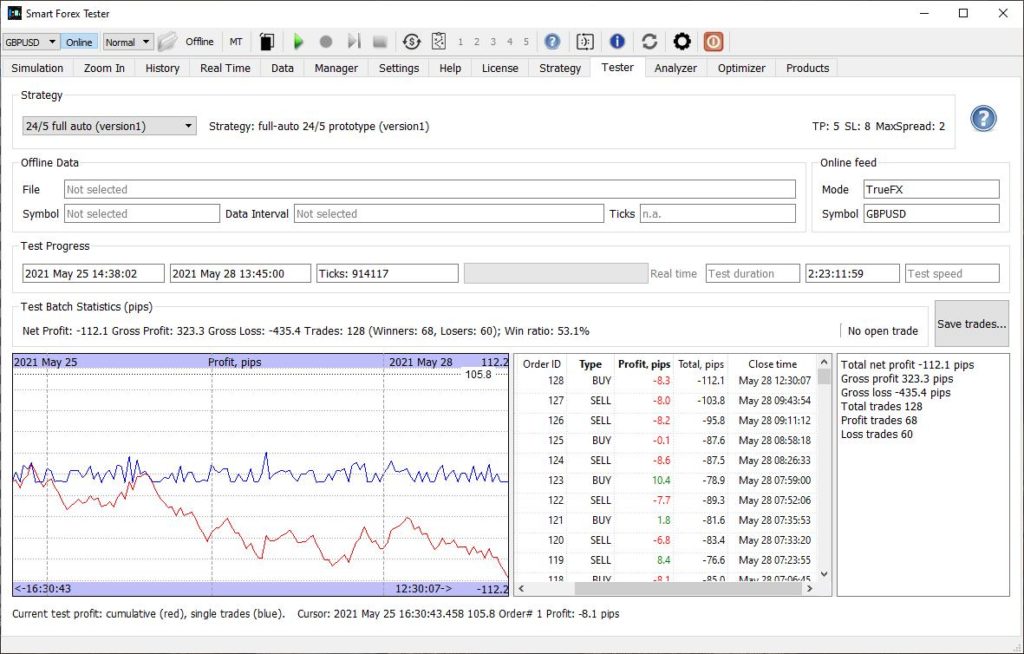
However, the most interesting about this modification was its performance in our April-May 2021 06.00-18.00 UTC test, where the baseline of the version2 lost 376.8 pips.
The modified strategy cut the losses by over 300 pips – and the draw-down was not bad, either. See the screenshot below.
Modified version2 almost recovered over 500 pips “blind spot” draw-down.
This is a stunning development – because this modification didn’t yet address the “blind spot” issue!
So, in the April-May 2 month test the modified strategy nearly recovered from over 500 pips blind spots losses. You can check out the details in the trade log.
We will research and test this more before publishing. Stay tuned!
In this post we share the results of our testing on GBPUSD during the first 3 weeks of November.
Pound is our preferred instrument, because it is more volatile than many other main pairs and it is traded quite actively.
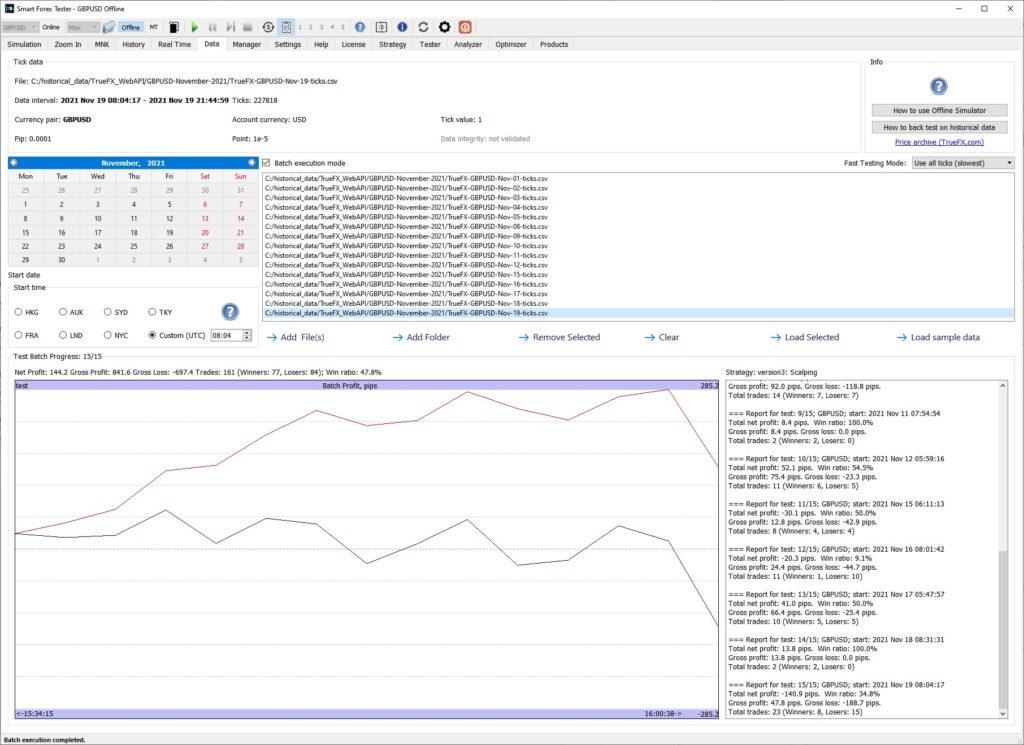
The below screenshot shows the profit development for the first 15 trading days of November 2021. Each trading day, we saved ticks and then we ran them all in our Batch Tester in one go. We only tested during the most volatile time, so we set the Scheduler to restrict trading between 21.40-07.00.
Total profit – 144 pips and the growth is steady – except for 1 day.
Overall, the result was very positive – 144 pips. And as you can see, the absolute draw down was small on the test batch graph. The same pattern we observed for nearly each test case (i.e. trading day).
You can check the details of every trading day in the trade log.
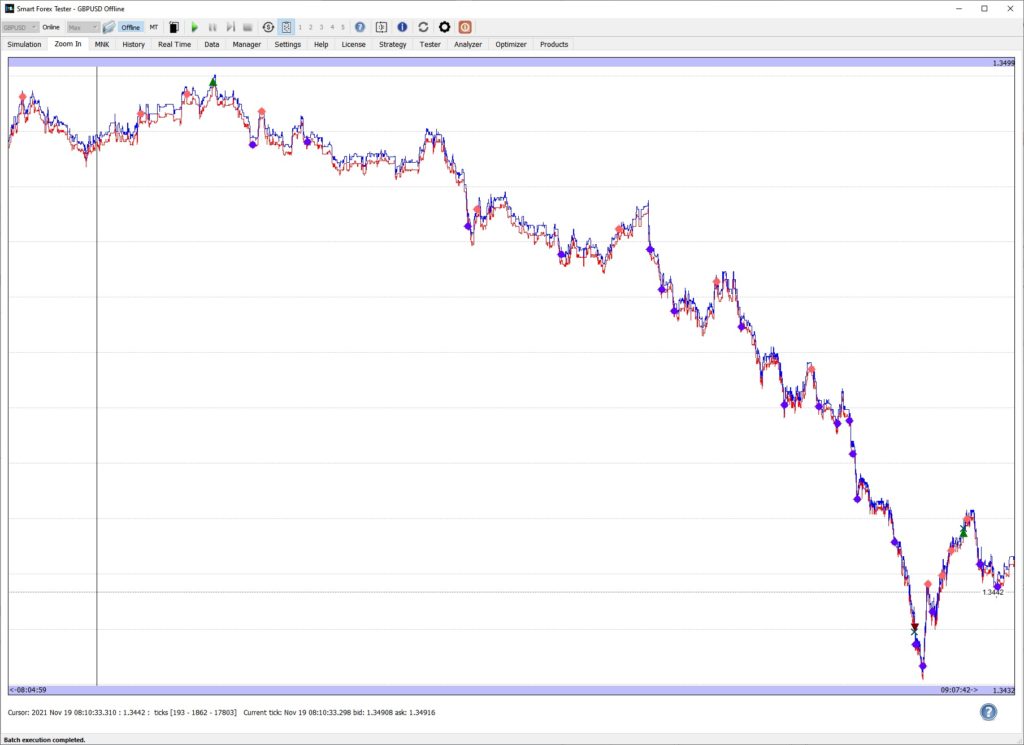
The only day when the trading strategy had a significant draw down was November 19. Let’s take a look what happened then.
No reversal signal generated – SL is triggered
We can see that the very first market entry was extremely unlucky. The market turned and started trending in the opposite direction until the stop loss was reached. This is a known issue with the version2 baseline – we called it a “blind spot“, and it is a sequence of 2 events.
First, wrong entry timing. Since all our strategies adjust to the market action, we should have sufficient market data prior to the first entry. This is achieved with a help of the Scheduler – we start couple of hours before the trading is allowed. Case in point, the test was started too late without enough time to collect the data.
Next, the trend is powerful enough not to generate a reversal signal. This is pretty easy to fix, but we haven’t yet found a way to instigate a reversal only in this situation. All the fixes we tried so far had side effects. We continue working on the fix, of course.
Keep these blind spots in mind when you try the new baseline strategy yourself. Fortunately, these situations are not frequent. E.g. in our 3 weeks test, we only had one occurrence.
In addition, since version2 places much fewer trades than its predecessor, it is easy to make necessary corrections manually.
Furthermore, the potential win ratio of version2 is higher than that of version1, and quite often exceeds 90%. This, and fewer trades, gives you ample opportunities to take profits manually, if you want to.
An important point in this regard. Even when an automated trading strategy is running, you can always close the trade it opened – like the BUY position in the example above. But keep in mind that after your manual action the strategy can open a new one immediately after – if the entry conditions are met.
To give you better control over situations like this, we recently added 3 new buttons for manualAutomated Trading Strategy control. You can forbid the strategy from opening new trades and also from closing an existing one.
And now these buttons come very handy to deal with occasional blind spots of current version2.
Case in point, when you notice a blind spot like the one on the screenshot, you need to first forbid opening new BUY trades. Then you manually close the current trade and open a SELL trade. Note that you have plenty of time to make a decision.
If you want to repeat our test yourself, here are all the tick data files. We used standard PPA parameters (100/100/254/5/15) and set TP=SL=60 pips. Maximum spread was set to usual 2 pips.
Note that the TP logic of version1 is retained in version2. But we wanted the strategy to use essentially its own logic, so we set the TP to a very big number. If you want, you can experiment with other levels.
Summary: version2 trading strategy fixes the weak points of the prototype version1 strategy, places considerably fewer trades but delivers better results and potential win ratio. Even in its very first release, version2 shows a solid potential but currently it may require manual intervention in some cases.
Background: the trading strategy (version1) we delivered with the very first release of our Day Trader software turned out to be quite a success – this prototype strategy raked 5,000+ pips in 5 month in our 24/5 GBPUSD forward test. And not less important, the profit grew steadily with minimal draw-downs.
During the following 3 months, the version1 worked much worse. However, the overall result was still decent: 1,100 pips in 8 month. Which is, by the way, well over 10% annually even without any leverage!
That said, we just couldn’t be satisfied with such uneven trading performance and continued working on the strategy improvements. And finally, we are ready to introduce the baseline of the version2.
Version1 trading strategy manages to catch an emerging trend quite well. But its simple profit taking mechanism is far from optimal. While the potential win ratio is consistently over 70%, realized win ratio is about 50%. Which – given the average trade profit – is often not enough to be profitable overall.
Version2 addresses the inefficiency of profit taking by totally changing its algorithm. We don’t use the trailing in the profit taking any more. Both take profit and stop loss decisions are now derived essentially from the market action.
We also refined the market entry criteria. While we still fully rely on our know-how – the Pivot Points Analyzer signals in timing the market, version2 also follows the market “big picture” to only select the major reversal points.
An obvious test for any new strategy would be the failed part of our previous test (i.e. March, April and May of 2021). So here it goes.
As a refresher, our original test was running 24/5. It was affected by the Rollover period after the New York trading session, when the spreads jump tenfold in a matter of ticks. Later on, we implemented the Scheduler – a software module designed to forbid trading during the specified time interval.
March 2021
In the original 24/5 test, version1 suffered a whopping 1,675.4 pips loss. With the Scheduler, we ran a much more realistic test – only selecting the time period when the markets are most volatile: 06.00-18.00 UTC. This helped a lot! But still the result remained negative: 462.7 pips loss.
Instead, new version2 strategy won 151 pips in the 06.00-18.00 UTC test. Quite an improvement when compared to almost 500 pips loss.
Of note, the win ratio was 42% – substantially lower than what version1 needed to turn a profit. Apparently the improved profit taking mechanism in version2 makes it capable of taking much bigger profits from a single trade.
Another noteworthy fact is that potential wins ratio in version2 is about 10-15 percentage points higher than for version1.
Below is the breakdown of the test results as reported by the Batch Tester that we use for the bulk of our testing. Normally, we test on a batch of weekly files.
=== Report for test: 1/5; GBPUSD; start: 2021 Mar 09 21:11:36 Total net profit: 35.7 pips. Win ratio: 52.9% Gross profit: 184.0 pips. Gross loss: -148.3 pips. Total trades: 34 (Winners: 18, Losers: 16) === Report for test: 2/5; GBPUSD; start: 2021 Mar 07 22:09:39 Total net profit: -20.9 pips. Win ratio: 34.2% Gross profit: 134.9 pips. Gross loss: -155.8 pips. Total trades: 38 (Winners: 13, Losers: 25) === Report for test: 3/5; GBPUSD; start: 2021 Mar 28 21:07:00 Total net profit: 71.3 pips. Win ratio: 46.8% Gross profit: 241.5 pips. Gross loss: -170.2 pips. Total trades: 47 (Winners: 22, Losers: 25) === Report for test: 4/5; GBPUSD; start: 2021 Mar 21 21:06:51 Total net profit: 5.9 pips. Win ratio: 40.3% Gross profit: 241.7 pips. Gross loss: -235.8 pips. Total trades: 67 (Winners: 27, Losers: 40) === Report for test: 5/5; GBPUSD; start: 2021 Mar 14 22:52:23 Total net profit: 59.1 pips. Win ratio: 39.4% Gross profit: 417.9 pips. Gross loss: -358.8 pips. Total trades: 71 (Winners: 28, Losers: 43)
If you have got our Automated Day Trading System, and want to go into details, you can download the tick data files from the original tests and run the strategy yourself. To compare with our results, set the parameters as follows: SL=60, TP=60; max spread=2, and use the default PPA settings (5/15/100/100/254).
April 2021
In the original test, version1 lost 922 pips. With the Scheduler set to only trade between 06.00-18.00 UTC, the result improved but we still had 521.8 pips loss.
Version2 sustained a 158.1 pips loss in the 06.00-18.00 UTC test. Below is the breakdown by weeks.
=== Report for test: 1/6; GBPUSD; start: 2021 Apr 04 21:06:46 Total net profit: 75.7 pips. Win ratio: 40.4% Gross profit: 362.3 pips. Gross loss: -286.6 pips. Total trades: 57 (Winners: 23, Losers: 34) === Report for test: 2/6; GBPUSD; start: 2021 Apr 25 21:07:22 Total net profit: -31.4 pips. Win ratio: 43.5% Gross profit: 219.0 pips. Gross loss: -250.4 pips. Total trades: 46 (Winners: 20, Losers: 26) === Report for test: 3/6; GBPUSD; start: 2021 Apr 22 03:41:44 Total net profit: -14.6 pips. Win ratio: 37.5% Gross profit: 95.0 pips. Gross loss: -109.6 pips. Total trades: 24 (Winners: 9, Losers: 15) === Report for test: 4/6; GBPUSD; start: 2021 Apr 18 21:35:35 Total net profit: -47.8 pips. Win ratio: 31.3% Gross profit: 145.3 pips. Gross loss: -193.1 pips. Total trades: 32 (Winners: 10, Losers: 22) === Report for test: 5/6; GBPUSD; start: 2021 Apr 11 21:12:01 Total net profit: -55.7 pips. Win ratio: 41.4% Gross profit: 112.5 pips. Gross loss: -168.2 pips. Total trades: 29 (Winners: 12, Losers: 17) === Report for test: 6/6; GBPUSD; start: 2021 Apr 01 07:00:13 Total net profit: -84.3 pips. Win ratio: 33.3% Gross profit: 45.9 pips. Gross loss: -130.2 pips. Total trades: 15 (Winners: 5, Losers: 10)
The first impression is that verion2 blows version1 off out of the water.
While this is definitely correct, all what matters in the end is profitability. Which the first release of version2 couldn’t deliver in this nasty 3 month test.
Fortunately, it appears there is a silver lining. The main point here is that the version2 losses are of a different nature than for version1 (where they were accumulating over many small loss trades).
Let’s dive into details.
“Blind Spot”
Like we said, version2 trading strategy exits the market based on essentially only the market action – as advised by the PPA signals. However, we do have a loose stop just as a precautionary measure (60 pips).
NOTE it doesn’t matter whether the stop is set at 60 or 100 pips. We just wanted to set it far enough for a trade not to close too often – to be, in a way, only punished once when we are positioned incorrectly.
What we found was that the baseline version2 strategy may be vulnerable in the case of a sequence of events. First, after a trade is placed, a trend continues in the unfavorable direction. In addition, the trend is powerful enough not to trigger the PPA dots sequence for a reversal.
This scenario is relatively rare: we noticed in our testing that it happens 1-2 times a trading week.
Being now aware of the issue, we are working on the fix. That said, all the ideas we have tried for now – even though eliminating these rare big losses – produced worse trading result overall.
So, for now we are OK with the baseline version2. You will understand our reasoning when you look at the example below.
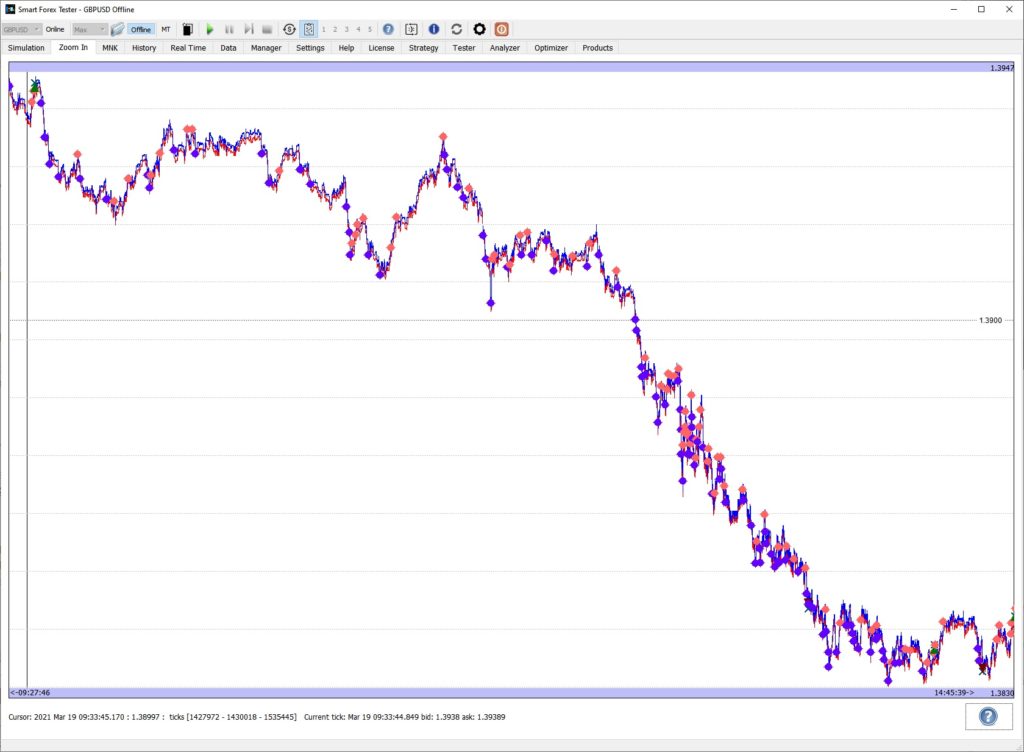
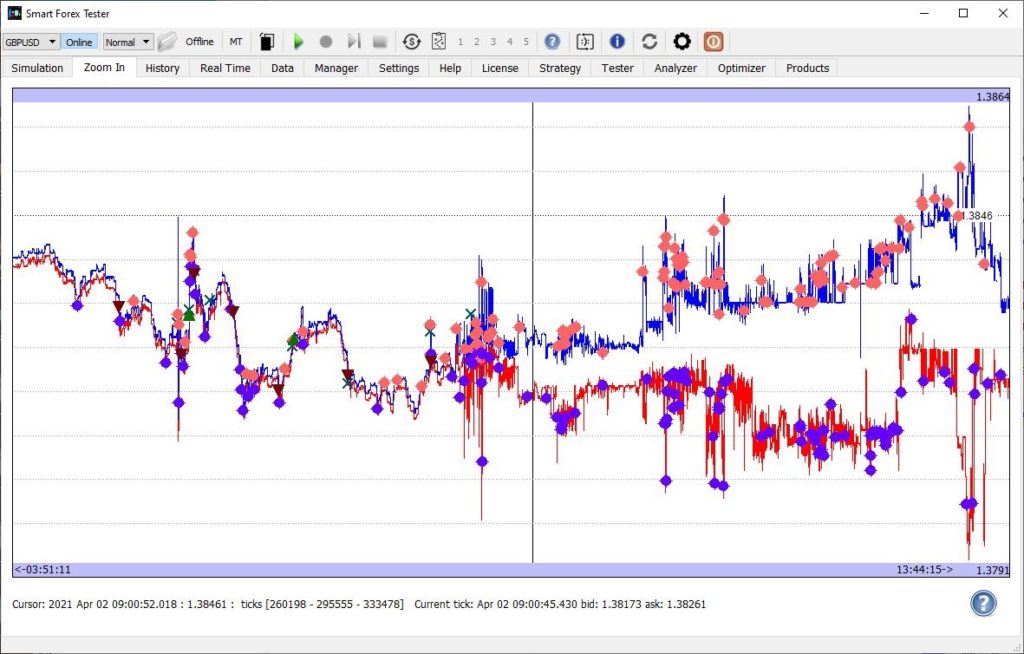
Version2 strategy fails to reverse a position on a powerful trend
The timing for a BUY trade (a green triangle in the upper left corner of the graph) was the worst possible. Instead of bottoming out as we expected, the market instead continued to move down for another 100 pips or so.
Moreover, there were no exit signals for the whole time – and consequently, the trade stayed open until the loss limit hit (spot a cross sign in the bottom right corner). Note that at times, the loss can be less than shown above – if the Scheduler closes the trade earlier – when the trading restrictions start.
Why are we not worried now while we haven’t yet improved the algorithm? Because 1) the situations like this are rare and 2) in real trading, you would have plenty of time to manually close the position with way less losses – at the very least. Or, better still, to open a new position along the trend. Both options should considerably improve the bottom line.
In the March 2021 test, we were stopped out 3 times (and still managed to turn a profit!). In April 2021, there were 5 such losing trades. In May 2021 – 6. This realized loss is almost 4 times as big as the total test result!
We highlighted these stopped trades in the trade log files, so you can review yourself.
See the reasoning 2) above: if you were monitoring the strategy, all you needed to do to make the total test result positive was to close all these losers with less loss. Even 40 pips loss instead of 60 would do – and it doesn’t look impossible.
Now, don’t get us wrong: this is an automated strategy and we are not saying that monitoring it all the time is a good thing. But we just wanted to analyze the pros and cons of the new baseline. And in our opinion the new strategy looks very promising, so we will be working on its improvements.
Fewer trades
One important feature of the new strategy is that it places much fewer trades than version1. This both brings in savings on broker’s commissions and makes manual intervention easier.
Fewer trades also means the broker’s slippage affects the strategy performance to a less extent.
Last but not least, fewer trades makes the strategy less dependent on the quality of the data feed.
With version1, the Trade Copier from the inbuilt TrueFX feed to the MT brokers we tried was not very successful. We expect Version2 to be much more robust in this respect.
Bottom line: with a help of the Scheduler restricting our 24/5 strategy from trading on less volatile time intervals (Asian sessions), we could cut losses up to 43% while only reducing the number of trades by 22%. While the scheduler can’t improve the strategy as such, restricting the trading to only the periods of highest volatility helped – because the current strategy works best during powerful price moves.
Background. We have been testing our automated trader on GBPUSD for 8 month (test report). In all these tests, we kept the strategy running 24/5.
As our analysis showed, there have been frequent considerable losses when the strategy had a position open by the Rollover after the New York close (5PM EST). When the Rollover started, the spread was increasing from normal (~1 pip) to tens of pips in a matter of several ticks. Making trade closing without losses impossible even for our tick-based strategies.
However, this pattern is completely predictable and so, these losses are avoidable if we use time scheduling.
In the latest release of our software, we implemented a Scheduler, which forbids opening of new trades during a specified time interval – even if all market entry criteria are otherwise met.
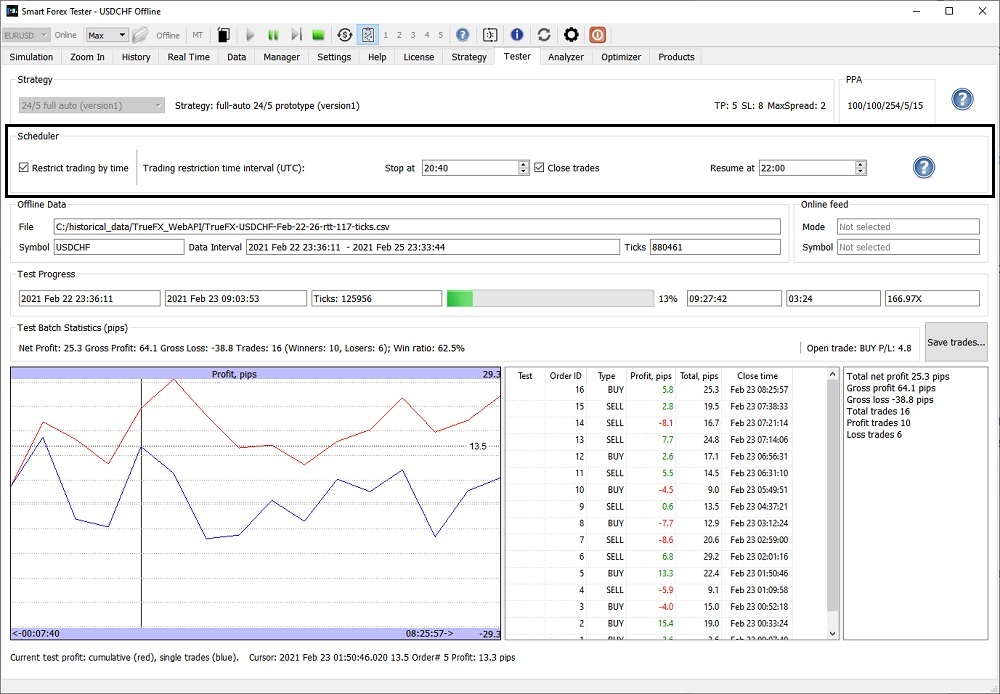
Automated Trader control with a Scheduler
Use the Scheduler is very easy. Use the Stop at and Resume at controls to specify the beginning and the end of the time interval when you don’t want the automated trader to be active, then check the Restrict trading by time box.
You can enable/disable the Scheduler and change the times also during a running simulation.
The times are entered in UTC. The maximum duration of the restriction is 24 hours. If you enter the same time into both controls, there will be no restrictions.
If there is an active trade when the time restriction starts, the position will be closed.
To test the Scheduler, we re-ran the April 2021 and May 2021 tests with the trading restriction time interval set to 20.40-22.00 UTC.
As expected, we could cut losses considerably: 12% (114 pips) in the April test and 14% (209 pips) in the May test.
You can try this for yourself using the tick data from our tests. We suggest you use our reworked Batch Tester to speed up the testing.
Then, we re-ran the April test with the Scheduler set to pause trading for the Asian sessions (restriction period: 18.00-06.00). The idea was to mostly utilize more volatile Europe and the US sessions.
We were able to cut losses by 43% (400.2 pips) compared to the original test; with 49.8% win ratio achieved.
At first glance, this might seem logical – since we restricted trading during half of the trading day. However, we need to look at the number of trades, not time.
Here is the breakdown of the test re-run. In [] we showed the numbers of trades in the respective original tests. You can compare with the original April test.
=== Report for test: 1/6; GBPUSD; start: 2021 Apr 04 21:06:46 Total net profit 27.2 pips Total trades 203 [236] Profit trades 112 Loss trades 91
=== Report for test: 2/6; GBPUSD; start: 2021 Apr 25 21:07:22 Total net profit -169.8 pips Total trades 206 [257] Profit trades 97 Loss trades 109
=== Report for test: 3/6; GBPUSD; start: 2021 Apr 22 03:41:44 Total net profit -99.0 pips Total trades 85 [101] Profit trades 39 Loss trades 46
=== Report for test: 4/6; GBPUSD; start: 2021 Apr 18 21:35:35 Total net profit -4.4 pips Profit trades 58 [142] Loss trades 53
=== Report for test: 5/6; GBPUSD; start: 2021 Apr 11 21:12:01 Total net profit -175.1 pips Total trades 159 [191] Profit trades 76 Loss trades 83
=== Report for test: 6/6; GBPUSD; start: 2021 Apr 01 07:00:13 Total net profit -90.9 pips Total trades 49 [54] Profit trades 23 Loss trades 26
Total trades: 760. But in the original test there were 981 trades. The difference is only 22%. So 43% of the loss reduction is significant. It can be explained by greater win ratio during higher volatility periods.
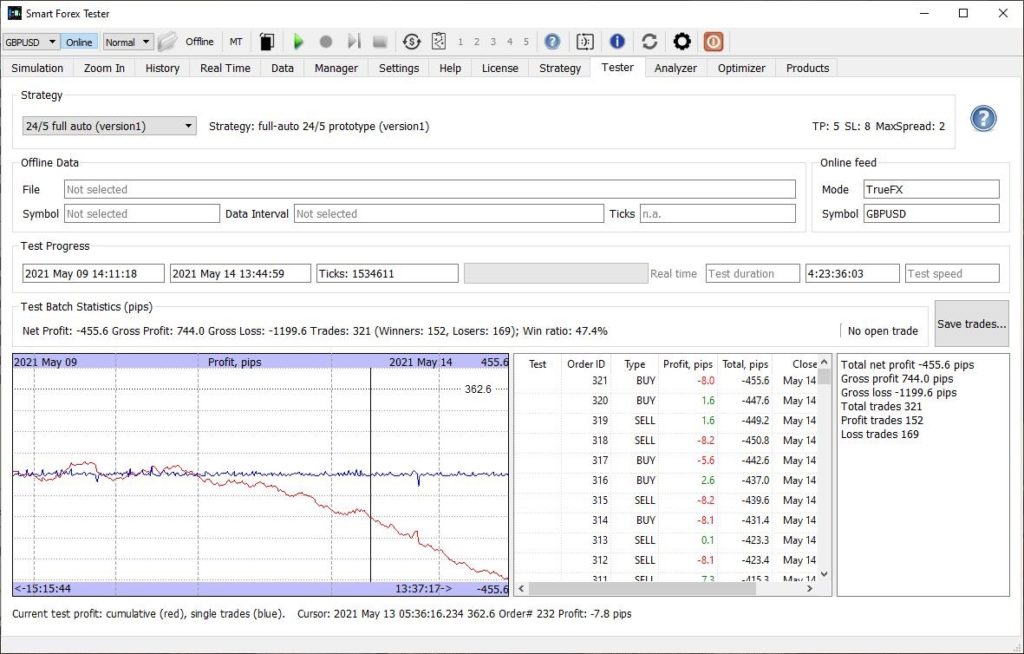
Finally, we also re-ran the May test with the same trading restrictions (18.00-6.00) and the results were in line with the April ones.
With the Scheduler, we cut losses 36% (557.3 pips). But the number of trades only reduced 16% (883). the overall win ratio was 48.9%
Here is the breakdown of the May test re-run. In [] we showed the numbers of trades in the respective original tests.
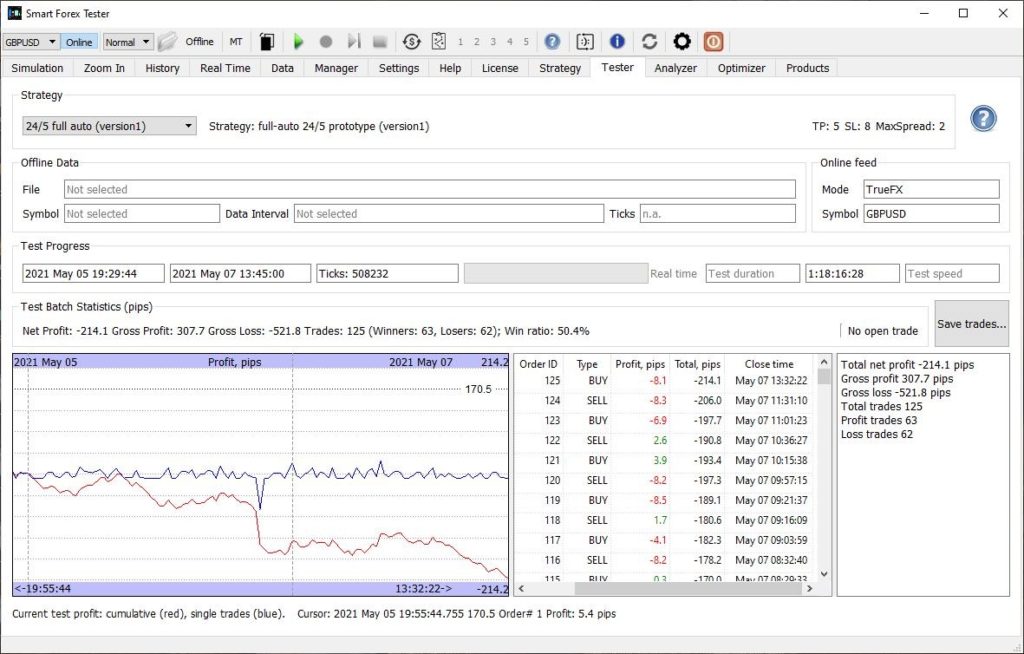
=== Report for test: 1/6; GBPUSD; start: 2021 May 09 21:11:20 Total net profit -243.4 pips Total trades 266 [321] Profit trades 132 Loss trades 134
=== Report for test: 2/6; GBPUSD; start: 2021 May 06 02:29:45 Total net profit -101.3 pips Total trades 113 [125] Profit trades 59 Loss trades 54
=== Report for test: 3/6; GBPUSD; start: 2021 May 25 21:38:03 Total net profit -106.5 pips Total trades 113 [128] Profit trades 60 Loss trades 53
=== Report for test: 4/6; GBPUSD; start: 2021 May 23 21:18:39 Total net profit 21.6 pips Total trades 62 [75] Profit trades 37 Loss trades 25
=== Report for test: 5/6; GBPUSD; start: 2021 May 02 21:25:44 Total net profit -48.6 pips Total trades 110 [130] Profit trades 54 Loss trades 56
=== Report for test: 6/6; GBPUSD; start: 2021 May 16 21:16:50 Total net profit -491.8 pips Total trades 219 [272] Profit trades 90 Loss trades 129
In conclusion, we can say that while the Scheduler definitely works well to reduce the drawdown, it is mostly important for the current initial versions of the strategy.
It won’t improve the strategies as such. And we are working towards our next goal – the improvements in the take profit algorithm efficiency. This is the “lowest hanging fruit” since we very consistently show 80%+ of potential wins but realized wins are about 50%.
In our latest software we have improved the Batch Tester functionality.
The Batch Tester is intended to run a number of test files in one go – one after another. The main use case for it is to combine the test data files for some market conditions, and then run them all as a single test.
You can use the Data Manager to load a large tick data file and find the price action that is of interest to you then save it as a separate smaller file.
When you have multiple files for the same price action, it is handy to run them all in one go, because it is much more focused and takes way less time than if you were to run tests on all the data.
How to use the Batch Tester: click on the Offline button on the Toolbar. Then, on the Data tab enable the Batch execution mode checkbox. Next, specify the test data: all the files present in the control will be run as a batch.
Edit the list of files you want to test on with a help of the Add File(s), Add Folder and Remove Selected buttons. The Add File(s) button allows multiple selection. The Clear button erases the entire list.
NOTE: the software will remember the batch content after restart.
When the batch is ready, on the Tester tab, select the trading strategy to test from the Strategy drop-down list. Now, you can start the test with the green Play button. All the test data files that you added in the batch will be executed one after another and the results for each test will be shown on the graph on the Data tab. Trading statistics for each batch will also be shown on the Tester tab.
In the Batch testing mode, you can use the Fast Testing Mode that can speed up your testing up to ten times, by running the tests only on a part of the ticks from the original test data file. Of course, the more ticks you skip, the less reliable the test result will be. So, you might want to run the tests multiple times with decreasing speed and monitor the consistency of the results.
May was the last month of our continuous live test started in October 2020.
Bottom line: total result is not as spectacular as the beginning (5000+ pips for first 5 month), but still the 8 month test is solidly profitable despite the very simple prototype strategy. How we were testing.
Here is the analysis and conclusions.
On the surface, the test result is good. The overall profit is over 1100 pips.
Moreover, the profit is actually significantly bigger – because in our simple strategy we didn’t do anything to properly handle the switching between the NA and Asian sessions.
So, if we happened to have an open trade at 5 pm Eastern, when the NA session closes, and spreads soar – the strategy was unable to close the position with the standard SL of 8 pips. Since spreads soar in the matter of literally 1-2 ticks, and as the result, the position closing losses could be in tenth of pips.
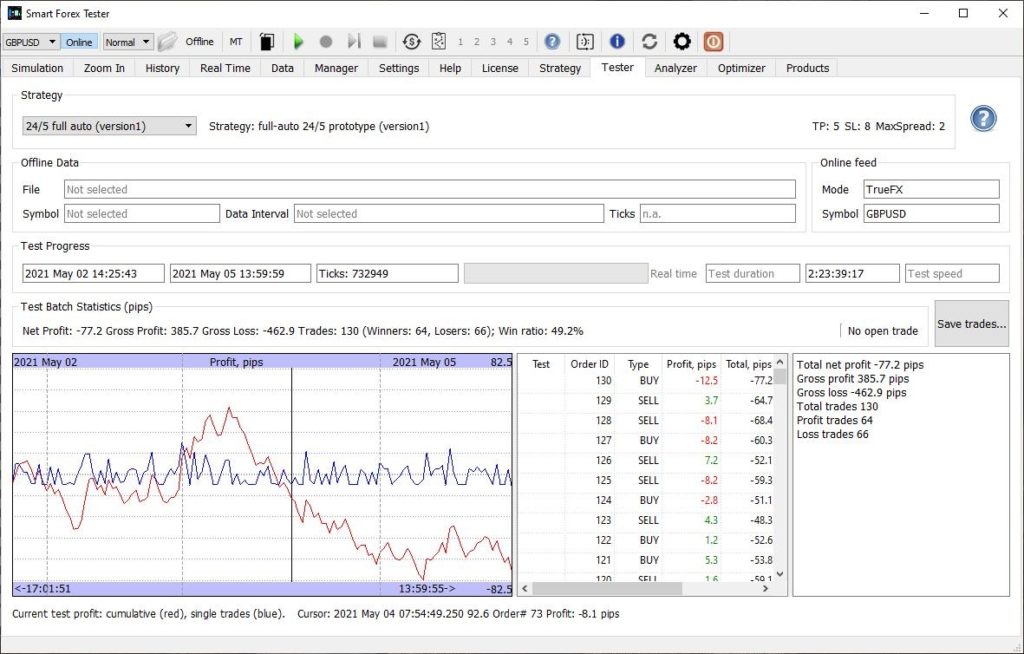
Only one example: on May, 6 the loss was over 70 pips (see the May 5-7 graph below).
This is a known technical issue – it can and should be avoided by just closing the position say 15 min before the NY close.
Furthermore, before we even started testing on a regular basis, in August and September 2020 we had seen similar results – hundreds of pips weekly. We just didn’t start documenting yet since the software was in developer testing mode.
And finally, the strategy we used was a very first prototype with a very simple profit taking logic and static stops. We can definitely do better. And we kept all the strategy parameters unchanged throughout the whole test.
But all that said, we are far from satisfied by the test results.
Here’s why.
First of all, the strategy just stopped performing after February. Stellar profits turned into consistent losses from March to May. It appears that something changed in the market after February 2021. Was it Brexit?
For the sake of comparison, in the last 3 month, we have been running the same strategy on EURUSD from time to time and the results were absolutely different.
We are not saying our strategy is perfect – quite the opposite. But if the strategy consistently loses in one market – something is just not matching here. Our understanding of this market probably.
On the bright side, we want to point out that with our strategy you can’t lose a lot – the losses come in small increments. So, in real trading – based on experience – we would have stopped trading promptly in the beginning of the week and continued to monitor it in the tester mode – until we saw market changed. Meaning that we definitely wouldn’t have ended up with a thousand pips weekly loss.
However, this is not a very good consolation. We need to make the strategy more robust and we are currently working on it. Read our previous posts for the ideas that we have of how to improve our strategy.
We will be using the saved tick by tick market data for the losing weeks to systematically test the newer versions of the strategy.
[We combined the report for 3 weeks into one, since they are pretty similar]
Bottom line: the strategy under test had no chances of turning profit in choppy price action with low volatility. This is known. However, half of the time the win ratio was around 50%. It used to be enough to score hundreds of pips of profit in more volatile markets. But not now – even combined with the highest on record potential win ratio. This stresses once again the need of profit taking algorithm improvement. Which could save the outcome even without switching between the current and the mean reversion strategy that we are developing.
That said, despite whopping 1,675.4 pips losses, this is not the end of the world. Losses are a part of the game: you can’t always win in the market. And overall, we are still over 3,000 pips up since last October.
In addition, one advantage of our strategies is that they don’t try to bet on a small number of huge wins but are gaining from multiple frequent trades. So, in a real trading, it would be easy to stop and cut losses short.
But since we are sticking to our plan, we keep the test running 24/5 with all the setup unchanged. Later on, we will use the recorded ticks to test all the strategy improvements we are currently working on.
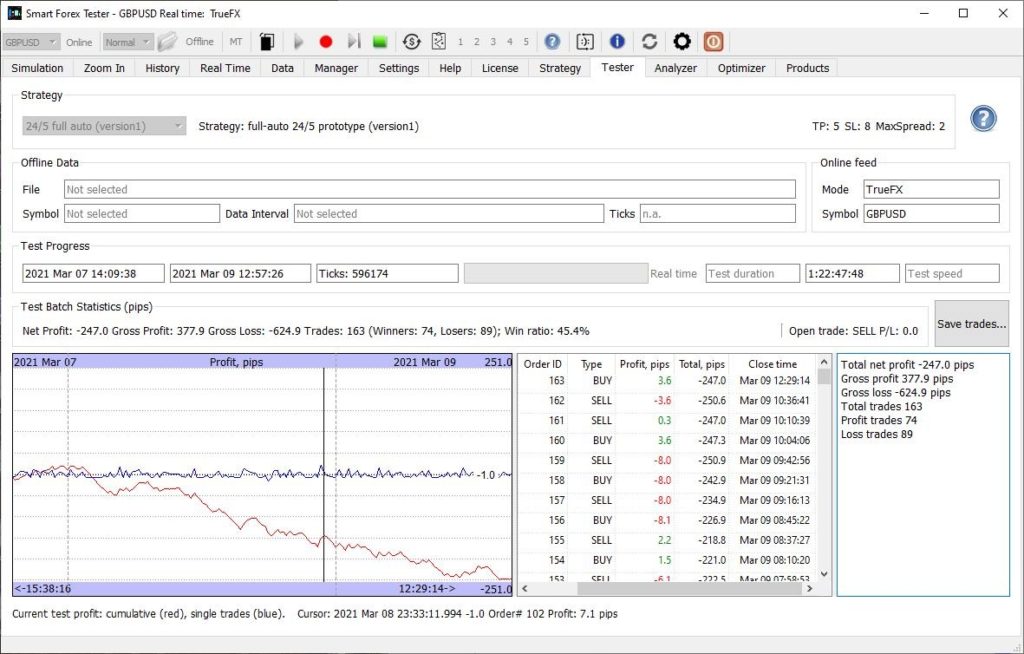
The second trading week of March was the worst in the entire 5.5 month long test. In total, our automated trader lost 447 pips.
There were only 3 losing weeks before that – and all had some holidays. This week didn’t present any such excuses. It was clearly visible that the overlapping price action with low volatility was a killer.
First 2 days – volatility 129 pips. Not much chance for the version1 strategy.
Turning 129 pips volatility in 2 days into profit was a nearly impossible mission for the version1 strategy
We had to restart the test to update the software to the latest build.
There is little to add about the rest of the week. Volatility was slightly higher, but price action stays the same, so the trading result didn’t improve.
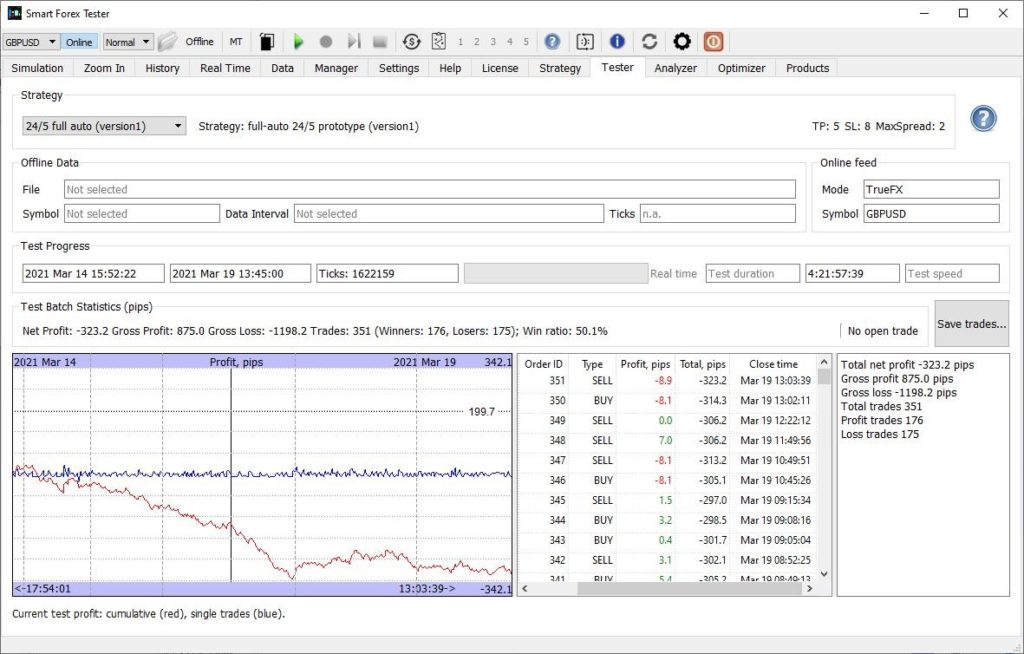
Markets on March 16-17 were too difficult – even overall 50% win ratio didn’t help
Out of curiosity we ran a series of back tests with different strategy parameters. We could cut total losses 3 times.
However, no parameters could cut losses during March 16-17. The price action during these 2 days was “mission impossible” for the used strategy. We will be add these 2 days to our negative test batch.
Interestingly, the strategy failed to turn profit with overall 50% win ratio. With price action we observed in previous 5 month in most cases it was able to take enough on the trend moves to cover the losses on the rangebound market.
But not now, because the price moves were not big ones to gain enough.
Furthermore the potential win ratio was one of the highest that we ever observed: 87%
Record potential wins could not materialize due to inferior profit taking
These percentages combined witness again the profit taking algorithm is leaving a lot of money on the tale. There is a huge potential once we make more “greedy”: trying to take what is available + attempt to re-enter on pullbacks.
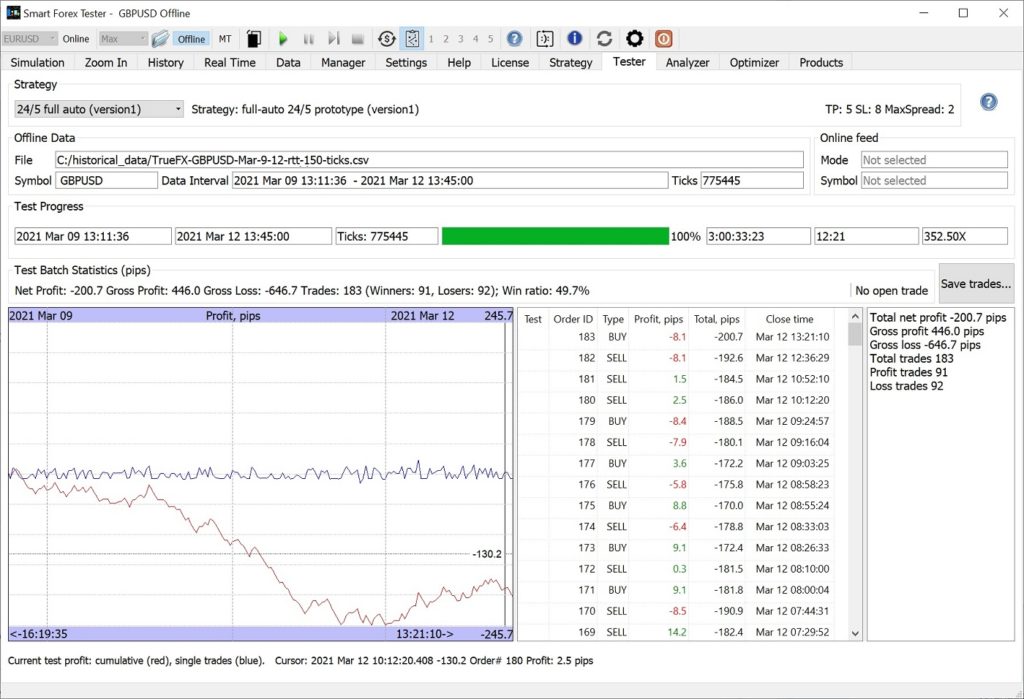
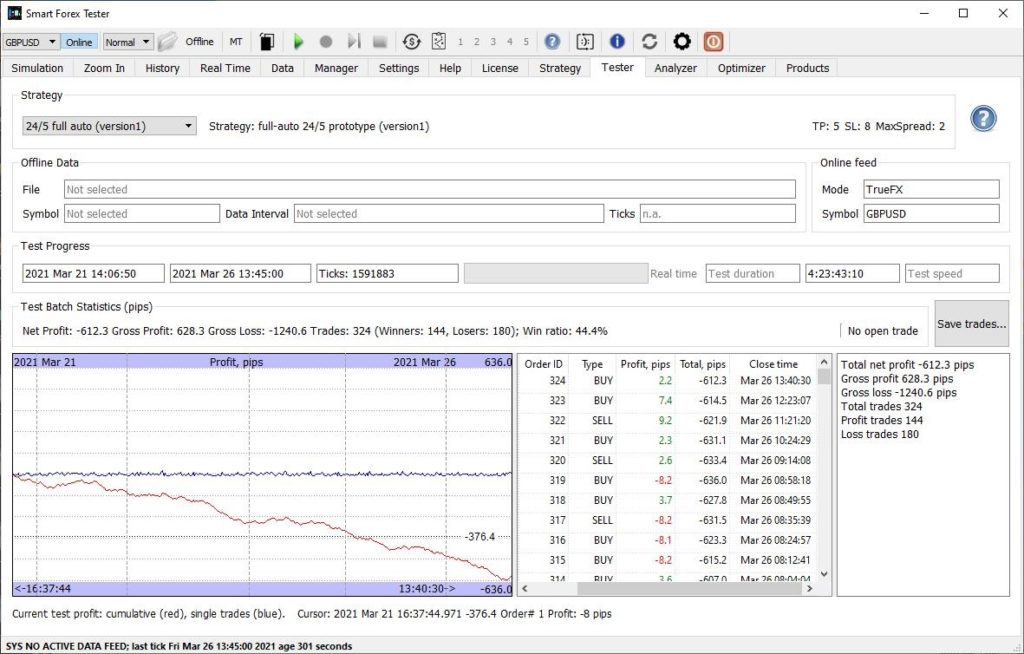
Week March 21-26
Basically, no changes. Despite good enough tick rate, low 209 pips volatility and choppy market action lead to similar results.
However, due to low win ratio of only 44% the bottom line is twice worse compared to the previous week (when the win ratio was 50%) and set a new anti-record of 612 pips.
Same pattern as last week, but losses are greater due to lower win ratio
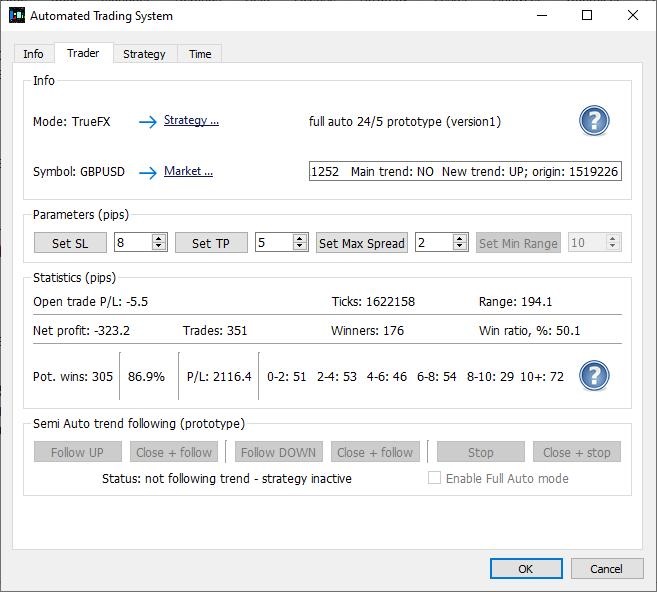
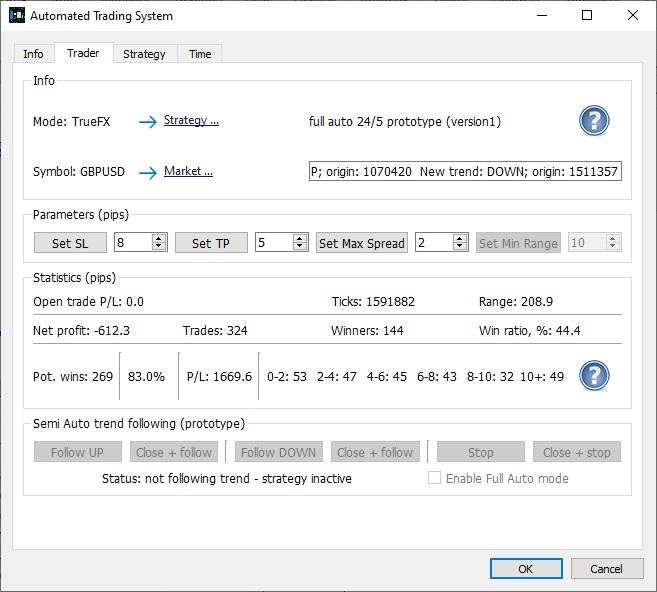
But the potential wins statistics remains basically unchanged.
Very high potential win ratio confirms market entries are flawless but profit taking is not