One of the principal advantages of the Pivot Point Analyzer is that on the trending market the signals it paints are in the same color sequence.
Our Automated Trader uses consistent PPA dot colors as a trend indicator, which unique advantage is that it works the better the stronger the trend is.
The screenshot below shows a tick graph for EURUSD spanning just 7 minutes in the beginning of the Asian session on March 8, 2020.
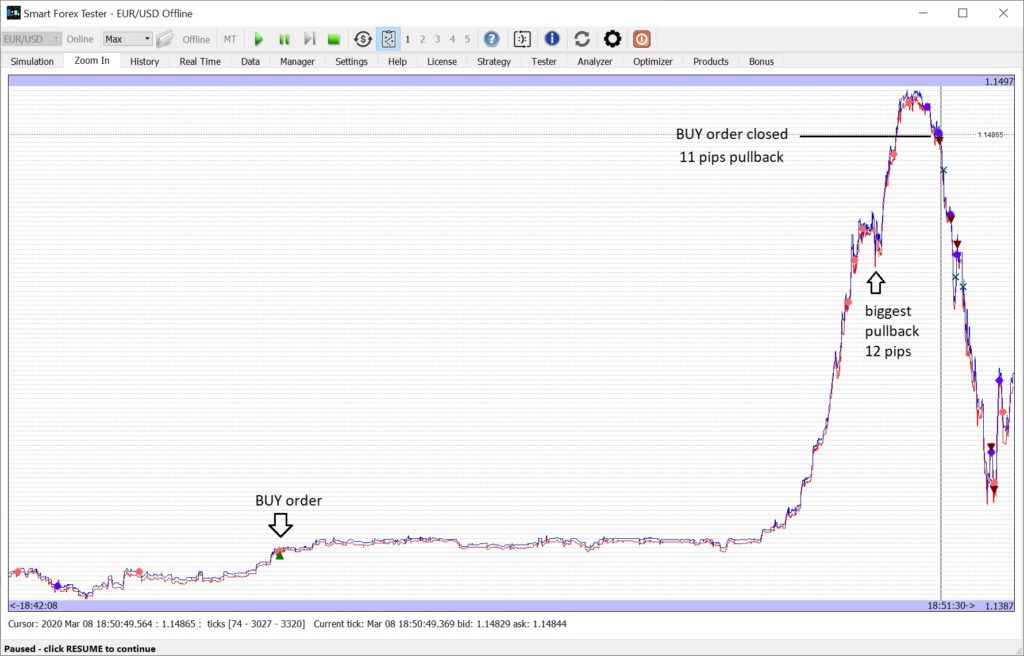
This day, a normally rather slow Asian session exploded. The Euro Dollar surged past 1.14 taking out stops placed around this level, and then skyrocketed to just shy of 1.15, recording a massive 100 pip surge in a matter of minutes, followed by a pullback almost as strong and swift.
Our automated strategy that we were forward testing this day had an entry rule to open a position as the emerging trend is forming when we have 2 dots of the same color in a rapid succession and with an advance in price levels. See the arrow on the graph when the BUY trade was entered after the 2nd red dot.
Next, there were only red dots all the way up to the very top, indicating the powerful up trend movement. Importantly, our strategy simply followed the red dots painting in real time and held the long buy trade as price pushed higher.
As price entered into an over-extension at the peak, the same rule worked in the opposite direction. The absolute market high was then followed in quick succession by 2 blue dots, signifying the beginning of a new down trend.
The autopilot PPA dot strategy instantly closed the long buy position at nearly maximum profit, then opened a fresh short sell trade in the opposite direction.
The “2-dot rule” we used in this example is just one possibility. There can be multiple other take profit algorithms. For example, you could try to play it safe and take profit at every red dot and then re-enter the market once the local top is breached.
Finally, note that the whole swing took less than 5 minutes. But since the PPA signals are plotted in real-time, our strategy managed to use this swing to score 150 pips profit.
Compare this to an indicator-based strategy that uses even 5-minute time frame.