Market timing is a cornerstone of any trading strategy. Indicators are widely used for that – i.e, to decide when to enter or exit the market.
A simple example: if RSI falls below 30, the market is oversold, so this is considered a “buy” signal.
However, using most indicators to time the market won’t work. Why? Because indicators introduce a time lag.
Meaning, the signals generated from indicators are based on the price action from the past. For example, on the M5 graph, a new reading comes every 5 minutes.
If you’ve watched the markets for some time, you know how much can happen during these 5 short minutes. To say nothing of the longer time frames.
A similar situation is with Elliott waves. They can hint at a very probable market action, but it’s nearly impossible to know when exactly it will happen. For example, 5th waves can always extend (which is even part of the Elliott theory).
Put another way, we always stumble upon a kind of an “uncertainty principle”. The clearer the market picture is, the longer it takes us to get it. And when
This is kind of obvious: nobody can predict the future.
Another – little less evident – problem with indicators comes from the fact that they are well-known. And when a lot of people are watching the same charts and expecting the same market behavior, it rarely happens. On the contrary, the market is known to deliver the maximum possible damage to as many people as it only can.
And finally, there is one more principal problem with any market signals based on price averaging.
“… the 200 moving average crosses the 50 moving average…” this kind of signals is probably familiar to you.
Even assuming this crossing happened right now (but not at least 50 periods back), signals like this are of little use for market timing in day trading.
Because you have to buy and sell in real-time
Where – instead of clean and smooth average graphs – you may find wild price swings within seconds and hundreds of new ticks coming each minute. If you ever looked at the tick graphs, you know what we mean.
And in day trading every single pip matters. Especially if you use leverage.
The swings can hurt you even when you guessed the time right. If your market entry was not perfect and the price later moved in the unfavorable direction. Which is what the market does most of the time.
Let’s take an example.
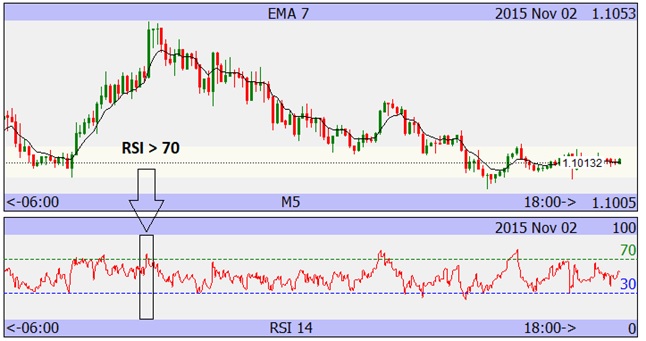
This M5 graph shows a quite calm European trading session. There is a nice market top around 9 AM (all times are GMT). Is it a clear profitable setup?
Let’s zoom in.
The figure below shows the real-time (tick) graph from the boxed area. Note that the price swings more than 20 pips.
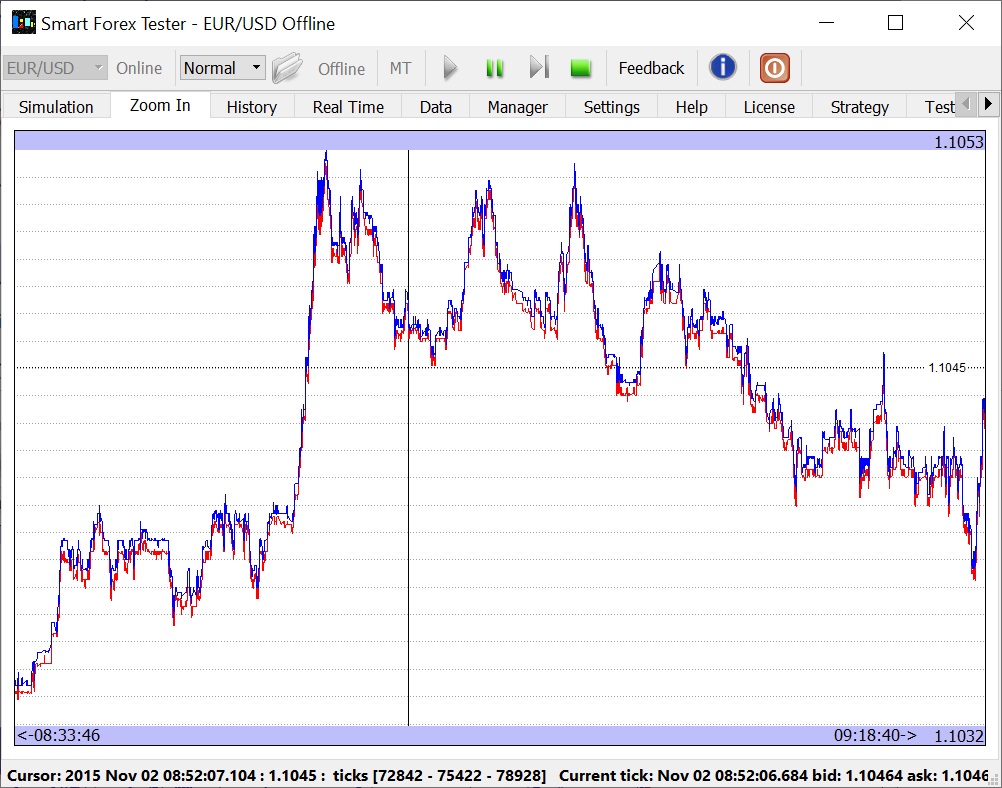
Imagine time is around 8.30 AM. You’ve been watching the market from its open (7 AM) and you see it went up nicely.
Around 9 AM you notice the market appears to have peaked and starts to move down. You need to make a quick decision – and opening a short position looks absolutely justified.
You have no way of knowing that in ten minutes the market will surge another 10 pips (at each moment you could only see the part of the graph to the left of this time). But if you sold then, your position would have been in the red for quite a while.
Unfortunately, this is a typical situation. And like we said, this session was a relatively calm one. Lots of sessions have much wilder (and larger) price movements.
Looks like a dead end? In a way, it is – unfortunately, even all the power of modern AI can’t help us predict the markets.
We ditched indicators quite a while ago – and we never looked back.
We found our own market timing solution. Stay tuned.