Bottom line: during recent testing of our Automated Day Trader on live tick data, the baseline strategy showed stable profit on EURUSD and especially on GBPUSD, consistently winning about 55% of the trades. The best results were achieved while running on the inbuilt TrueFX data feed. Please try it out on your data feed.
We have been testing our strategies on mostly EURUSD and GBPUSD. We used the inbuilt online TrueFX data feed, and also the feeds from several brokers – via the MT connector.
One of the most important finding was that the trading result strongly depended on the data feed; the TrueFX live feed inbuilt in the Smart Forex Tester Suite turned out to be the best.
We noticed that TrueFX provided several times higher tick rate than all the other brokers we tested with. It appears that our PPA algorithm works very well on this combination of good tick data quality and the high tick rate.
Results were consistently good when tested on inbuilt data feed. The win ratio was around 50-60%. About 80% of the trading days were profitable; the losing days were infrequent and the losses were quite small.
The worst day was September, 21, when both pairs lost around 100 pips. Our analysis showed that despite the powerful downtrend, the price action was too difficult for the PPA to generate clear signals.
However, during the following days of that same week the baseline strategy pared losses and ended the week with 100+ (EURUSD) and 200+ (GBPUSD) pips total profit.
Below you can find a sample of our results for the last 2 trading days. Dashed lines denote the opening of the UK session.
We were keeping the trader running without breaks in 100% full auto mode. You can see that the automated trader performed best during volatile UK sessions and the beginning of the North American sessions. Then it started losing – from the end of the US and into the Asian session. Partially this can be explained by the drawbacks of the used strategy – see the detailed analysis below.
Scheduling. To make the Trader more flexible, we are going to add the scheduler functionality. So that you could skip the Asian session, for example.
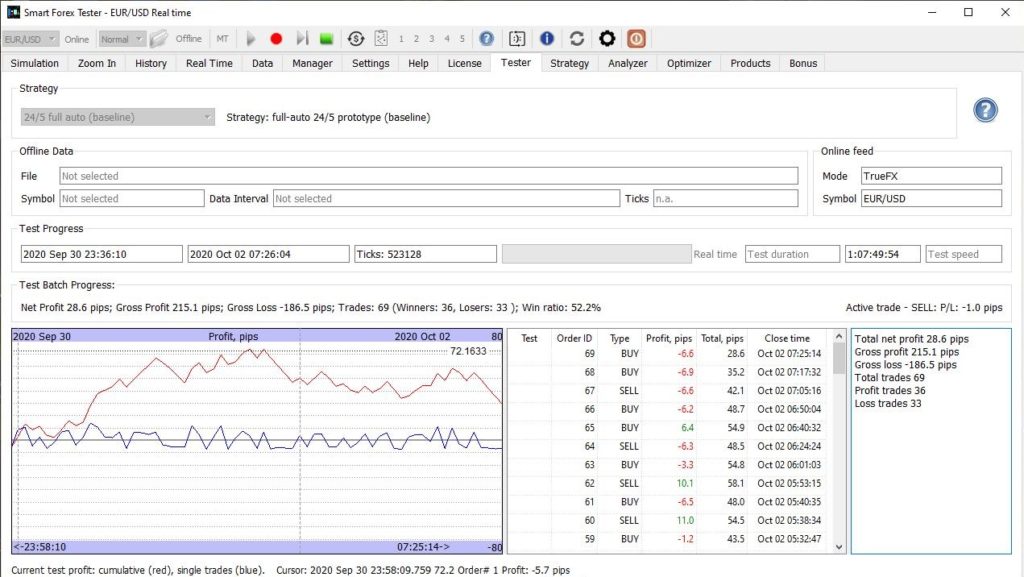
Euro was not very volatile this week, but still we got over 50% win ratio – which started deteriorating in the end of the Friday trading.
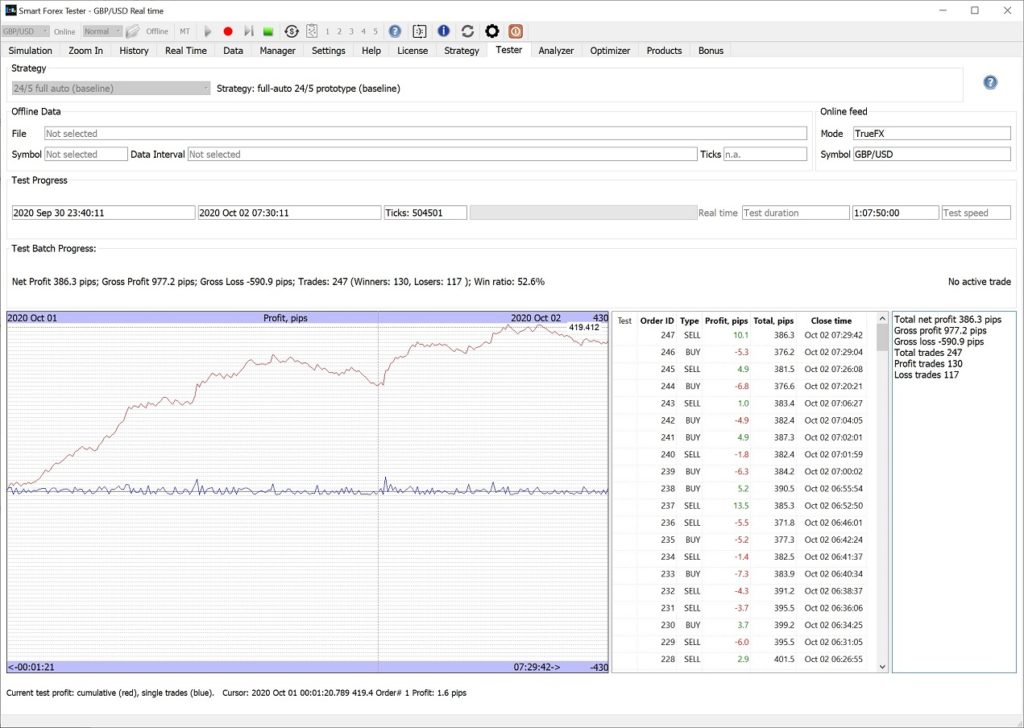
GBPUSD was a pleasant surprise. Quite often it produced the profit which was twice the volatility – like on the above graph.
For all the tests, we used the same parameters – see the picture below for the GBPUSD test. The PPA parameters were 100-100-254-5-15 (the controls listed from top to bottom).
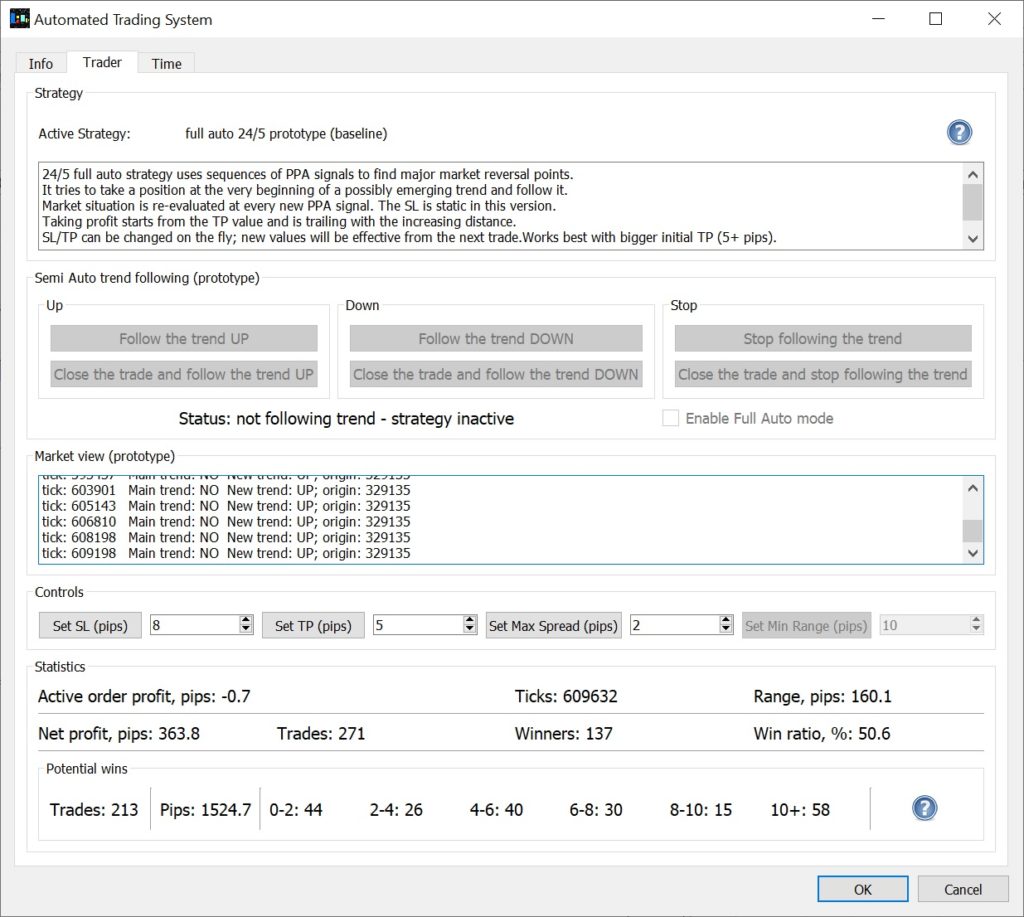
One very important point to notice here is high potential wins count – which attests to the fact that the PPA entry signals were quite accurate.
But the realized win ratio was considerably less. This is essentially caused by the far from ideal profit taking mechanism in the strategy we used.
Trading strategy that we were running most of the time was the 24/5 baseline prototype. This strategy is more trend-oriented. It looks for a sequence of 2 progressing same color dots to open a position in the direction of the emerging trend. For the range-bound markets with intensive see-sawing, this signal is not the best.
The take profit logic in the baseline strategy is as follows. When the current profit hits the TP level (set in the Trader GUI – see the above picture), the strategy moves the imaginary stop loss to the order entry level. In other words, should the market pull back now, the trade will be exited with about zero loss.
This imaginary exit level is moved every time when the profit makes a new high. In the beginning, it is moved by the difference between the current and the previous highs. However, as the profit grows, the exit level is moved slower and the gap to the current price gradually grows. This helps to avoid the early position closure on the market pullbacks.
The downside of this mechanism is though in that we may leave a lot of money on the table – when the market is choppy and goes nowhere. There you can spot the moments when after entering the market at the second PPA dot, there is a sharp reversal and the position becomes a loser immediately.
To improve the profit taking logic, we coded a modification of the baseline strategy (version1) that re-opens a position after the previous one was profitably closed on the pullback. With this strategy, you can set the TP threshold lower, thus triggering the closures more often – and relying on the re-entry.
Live data. We compared the ticks from the inbuilt TrueFX data feed with one real account we have access to. Importantly, we found out both feeds were matching each other quite well. But, like we said above, the TrueFX tick rate was 3-4 times higher.
We encourage you to repeat our tests on the live feeds available to you and share the results with us. Does your MT data feed have the tick rate comparable with the one the TrueFX feed has? What about tests profitability?
Trade copying. Your feedback is important, because we are thinking of implementing the functionality of copying trades. So, we can run the automated trader on the inbuilt TrueFX data feed, but send the trading commands to the MT connector to place the real trades.
Don’t have the Smart Forex Tester Suite yet? Get it here.