Summary: version2 trading strategy fixes the weak points of the prototype version1 strategy, places considerably fewer trades but delivers better results and potential win ratio. Even in its very first release, version2 shows a solid potential but currently it may require manual intervention in some cases.
Background: the trading strategy (version1) we delivered with the very first release of our Day Trader software turned out to be quite a success – this prototype strategy raked 5,000+ pips in 5 month in our 24/5 GBPUSD forward test. And not less important, the profit grew steadily with minimal draw-downs.
During the following 3 months, the version1 worked much worse. However, the overall result was still decent: 1,100 pips in 8 month. Which is, by the way, well over 10% annually even without any leverage!
That said, we just couldn’t be satisfied with such uneven trading performance and continued working on the strategy improvements. And finally, we are ready to introduce the baseline of the version2.
Version1 trading strategy manages to catch an emerging trend quite well. But its simple profit taking mechanism is far from optimal. While the potential win ratio is consistently over 70%, realized win ratio is about 50%. Which – given the average trade profit – is often not enough to be profitable overall.
Version2 addresses the inefficiency of profit taking by totally changing its algorithm. We don’t use the trailing in the profit taking any more. Both take profit and stop loss decisions are now derived essentially from the market action.
We also refined the market entry criteria. While we still fully rely on our know-how – the Pivot Points Analyzer signals in timing the market, version2 also follows the market “big picture” to only select the major reversal points.
An obvious test for any new strategy would be the failed part of our previous test (i.e. March, April and May of 2021). So here it goes.
As a refresher, our original test was running 24/5. It was affected by the Rollover period after the New York trading session, when the spreads jump tenfold in a matter of ticks. Later on, we implemented the Scheduler – a software module designed to forbid trading during the specified time interval.
March 2021
In the original 24/5 test, version1 suffered a whopping 1,675.4 pips loss. With the Scheduler, we ran a much more realistic test – only selecting the time period when the markets are most volatile: 06.00-18.00 UTC. This helped a lot! But still the result remained negative: 462.7 pips loss.
Instead, new version2 strategy won 151 pips in the 06.00-18.00 UTC test. Quite an improvement when compared to almost 500 pips loss.
Of note, the win ratio was 42% – substantially lower than what version1 needed to turn a profit. Apparently the improved profit taking mechanism in version2 makes it capable of taking much bigger profits from a single trade.
Another noteworthy fact is that potential wins ratio in version2 is about 10-15 percentage points higher than for version1.
Below is the breakdown of the test results as reported by the Batch Tester that we use for the bulk of our testing. Normally, we test on a batch of weekly files.
=== Report for test: 1/5; GBPUSD; start: 2021 Mar 09 21:11:36
Total net profit: 35.7 pips. Win ratio: 52.9%
Gross profit: 184.0 pips. Gross loss: -148.3 pips.
Total trades: 34 (Winners: 18, Losers: 16)
=== Report for test: 2/5; GBPUSD; start: 2021 Mar 07 22:09:39
Total net profit: -20.9 pips. Win ratio: 34.2%
Gross profit: 134.9 pips. Gross loss: -155.8 pips.
Total trades: 38 (Winners: 13, Losers: 25)
=== Report for test: 3/5; GBPUSD; start: 2021 Mar 28 21:07:00
Total net profit: 71.3 pips. Win ratio: 46.8%
Gross profit: 241.5 pips. Gross loss: -170.2 pips.
Total trades: 47 (Winners: 22, Losers: 25)
=== Report for test: 4/5; GBPUSD; start: 2021 Mar 21 21:06:51
Total net profit: 5.9 pips. Win ratio: 40.3%
Gross profit: 241.7 pips. Gross loss: -235.8 pips.
Total trades: 67 (Winners: 27, Losers: 40)
=== Report for test: 5/5; GBPUSD; start: 2021 Mar 14 22:52:23
Total net profit: 59.1 pips. Win ratio: 39.4%
Gross profit: 417.9 pips. Gross loss: -358.8 pips.
Total trades: 71 (Winners: 28, Losers: 43)
For your reference, here is also the trade log.
If you have got our Automated Day Trading System, and want to go into details, you can download the tick data files from the original tests and run the strategy yourself. To compare with our results, set the parameters as follows: SL=60, TP=60; max spread=2, and use the default PPA settings (5/15/100/100/254).
April 2021
In the original test, version1 lost 922 pips. With the Scheduler set to only trade between 06.00-18.00 UTC, the result improved but we still had 521.8 pips loss.
Version2 sustained a 158.1 pips loss in the 06.00-18.00 UTC test. Below is the breakdown by weeks.
=== Report for test: 1/6; GBPUSD; start: 2021 Apr 04 21:06:46
Total net profit: 75.7 pips. Win ratio: 40.4%
Gross profit: 362.3 pips. Gross loss: -286.6 pips.
Total trades: 57 (Winners: 23, Losers: 34)
=== Report for test: 2/6; GBPUSD; start: 2021 Apr 25 21:07:22
Total net profit: -31.4 pips. Win ratio: 43.5%
Gross profit: 219.0 pips. Gross loss: -250.4 pips.
Total trades: 46 (Winners: 20, Losers: 26)
=== Report for test: 3/6; GBPUSD; start: 2021 Apr 22 03:41:44
Total net profit: -14.6 pips. Win ratio: 37.5%
Gross profit: 95.0 pips. Gross loss: -109.6 pips.
Total trades: 24 (Winners: 9, Losers: 15)
=== Report for test: 4/6; GBPUSD; start: 2021 Apr 18 21:35:35
Total net profit: -47.8 pips. Win ratio: 31.3%
Gross profit: 145.3 pips. Gross loss: -193.1 pips.
Total trades: 32 (Winners: 10, Losers: 22)
=== Report for test: 5/6; GBPUSD; start: 2021 Apr 11 21:12:01
Total net profit: -55.7 pips. Win ratio: 41.4%
Gross profit: 112.5 pips. Gross loss: -168.2 pips.
Total trades: 29 (Winners: 12, Losers: 17)
=== Report for test: 6/6; GBPUSD; start: 2021 Apr 01 07:00:13
Total net profit: -84.3 pips. Win ratio: 33.3%
Gross profit: 45.9 pips. Gross loss: -130.2 pips.
Total trades: 15 (Winners: 5, Losers: 10)
For more details, check the trade log.
May 2021
In the original test, version1 lost 1527.3 pips. In 06.00-18.00 UTC test the result was better, but still it was 970 pips loss.
Version2 sustained a 218.7 pips loss in the 06.00-18.00 UTC test. Below is the breakdown by weeks.
=== Report for test: 1/6; GBPUSD; start: 2021 May 09 21:11:20
Total net profit: 16.1 pips. Win ratio: 39.1%
Gross profit: 332.8 pips. Gross loss: -316.7 pips.
Total trades: 69 (Winners: 27, Losers: 42)
=== Report for test: 2/6; GBPUSD; start: 2021 May 06 02:29:45
Total net profit: -65.5 pips. Win ratio: 48.3%
Gross profit: 139.2 pips. Gross loss: -204.7 pips.
Total trades: 29 (Winners: 14, Losers: 15)
=== Report for test: 3/6; GBPUSD; start: 2021 May 25 21:38:03
Total net profit: -36.3 pips. Win ratio: 40.0%
Gross profit: 139.9 pips. Gross loss: -176.2 pips.
Total trades: 40 (Winners: 16, Losers: 24)
=== Report for test: 4/6; GBPUSD; start: 2021 May 23 21:18:39
Total net profit: 7.8 pips. Win ratio: 50.0%
Gross profit: 97.9 pips. Gross loss: -90.1 pips.
Total trades: 16 (Winners: 8, Losers: 8)
=== Report for test: 5/6; GBPUSD; start: 2021 May 02 21:25:44
Total net profit: 59.0 pips. Win ratio: 42.3%
Gross profit: 202.6 pips. Gross loss: -143.6 pips.
Total trades: 26 (Winners: 11, Losers: 15)
=== Report for test: 6/6; GBPUSD; start: 2021 May 16 21:16:50
Total net profit: -199.8 pips. Win ratio: 35.7%
Gross profit: 97.9 pips. Gross loss: -297.7 pips.
Total trades: 28 (Winners: 10, Losers: 18)
For more details, check the trade log.
Analysis
The first impression is that verion2 blows version1 off out of the water.
While this is definitely correct, all what matters in the end is profitability. Which the first release of version2 couldn’t deliver in this nasty 3 month test.
Fortunately, it appears there is a silver lining. The main point here is that the version2 losses are of a different nature than for version1 (where they were accumulating over many small loss trades).
Let’s dive into details.
“Blind Spot”
Like we said, version2 trading strategy exits the market based on essentially only the market action – as advised by the PPA signals. However, we do have a loose stop just as a precautionary measure (60 pips).
NOTE it doesn’t matter whether the stop is set at 60 or 100 pips. We just wanted to set it far enough for a trade not to close too often – to be, in a way, only punished once when we are positioned incorrectly.
What we found was that the baseline version2 strategy may be vulnerable in the case of a sequence of events. First, after a trade is placed, a trend continues in the unfavorable direction. In addition, the trend is powerful enough not to trigger the PPA dots sequence for a reversal.
This scenario is relatively rare: we noticed in our testing that it happens 1-2 times a trading week.
Being now aware of the issue, we are working on the fix. That said, all the ideas we have tried for now – even though eliminating these rare big losses – produced worse trading result overall.
So, for now we are OK with the baseline version2. You will understand our reasoning when you look at the example below.
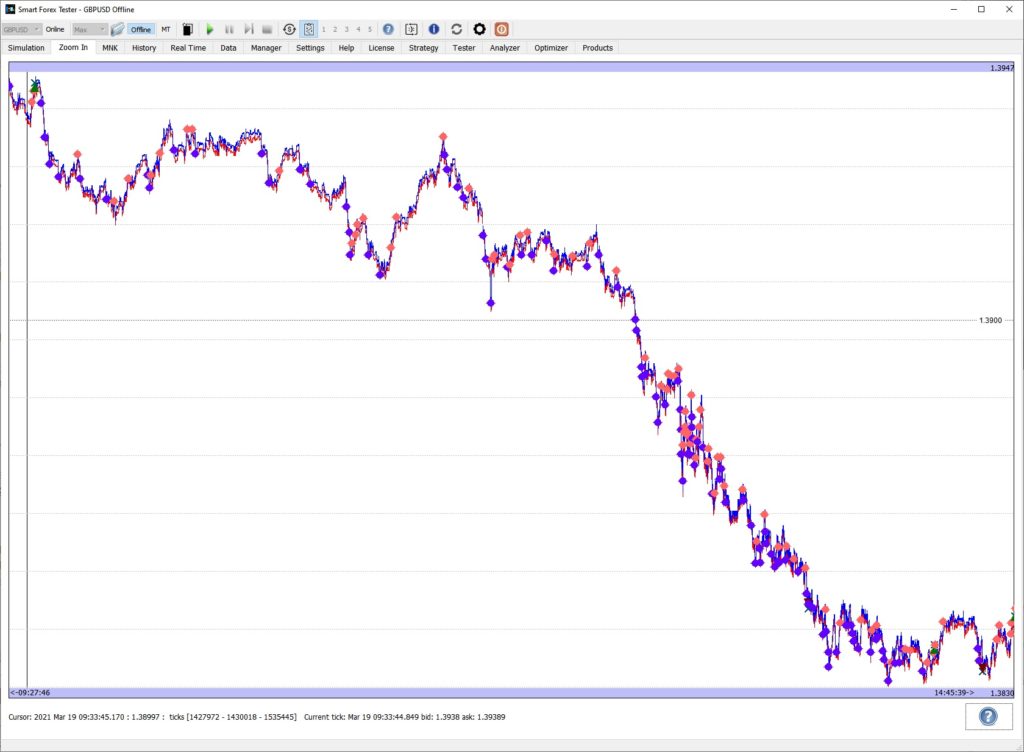
The timing for a BUY trade (a green triangle in the upper left corner of the graph) was the worst possible. Instead of bottoming out as we expected, the market instead continued to move down for another 100 pips or so.
Moreover, there were no exit signals for the whole time – and consequently, the trade stayed open until the loss limit hit (spot a cross sign in the bottom right corner). Note that at times, the loss can be less than shown above – if the Scheduler closes the trade earlier – when the trading restrictions start.
Why are we not worried now while we haven’t yet improved the algorithm? Because 1) the situations like this are rare and 2) in real trading, you would have plenty of time to manually close the position with way less losses – at the very least. Or, better still, to open a new position along the trend. Both options should considerably improve the bottom line.
In the March 2021 test, we were stopped out 3 times (and still managed to turn a profit!). In April 2021, there were 5 such losing trades. In May 2021 – 6. This realized loss is almost 4 times as big as the total test result!
We highlighted these stopped trades in the trade log files, so you can review yourself.
See the reasoning 2) above: if you were monitoring the strategy, all you needed to do to make the total test result positive was to close all these losers with less loss. Even 40 pips loss instead of 60 would do – and it doesn’t look impossible.
Now, don’t get us wrong: this is an automated strategy and we are not saying that monitoring it all the time is a good thing. But we just wanted to analyze the pros and cons of the new baseline. And in our opinion the new strategy looks very promising, so we will be working on its improvements.
Fewer trades
One important feature of the new strategy is that it places much fewer trades than version1. This both brings in savings on broker’s commissions and makes manual intervention easier.
Fewer trades also means the broker’s slippage affects the strategy performance to a less extent.
Last but not least, fewer trades makes the strategy less dependent on the quality of the data feed.
With version1, the Trade Copier from the inbuilt TrueFX feed to the MT brokers we tried was not very successful. We expect Version2 to be much more robust in this respect.