May was the last month of our continuous live test started in October 2020.
Bottom line: total result is not as spectacular as the beginning (5000+ pips for first 5 month), but still the 8 month test is solidly profitable despite the very simple prototype strategy. How we were testing.
Here is the analysis and conclusions.
On the surface, the test result is good. The overall profit is over 1100 pips.
Moreover, the profit is actually significantly bigger – because in our simple strategy we didn’t do anything to properly handle the switching between the NA and Asian sessions.
So, if we happened to have an open trade at 5 pm Eastern, when the NA session closes, and spreads soar – the strategy was unable to close the position with the standard SL of 8 pips. Since spreads soar in the matter of literally 1-2 ticks, and as the result, the position closing losses could be in tenth of pips.
Only one example: on May, 6 the loss was over 70 pips (see the May 5-7 graph below).
This is a known technical issue – it can and should be avoided by just closing the position say 15 min before the NY close.
Furthermore, before we even started testing on a regular basis, in August and September 2020 we had seen similar results – hundreds of pips weekly. We just didn’t start documenting yet since the software was in developer testing mode.
And finally, the strategy we used was a very first prototype with a very simple profit taking logic and static stops. We can definitely do better. And we kept all the strategy parameters unchanged throughout the whole test.
But all that said, we are far from satisfied by the test results.
Here’s why.
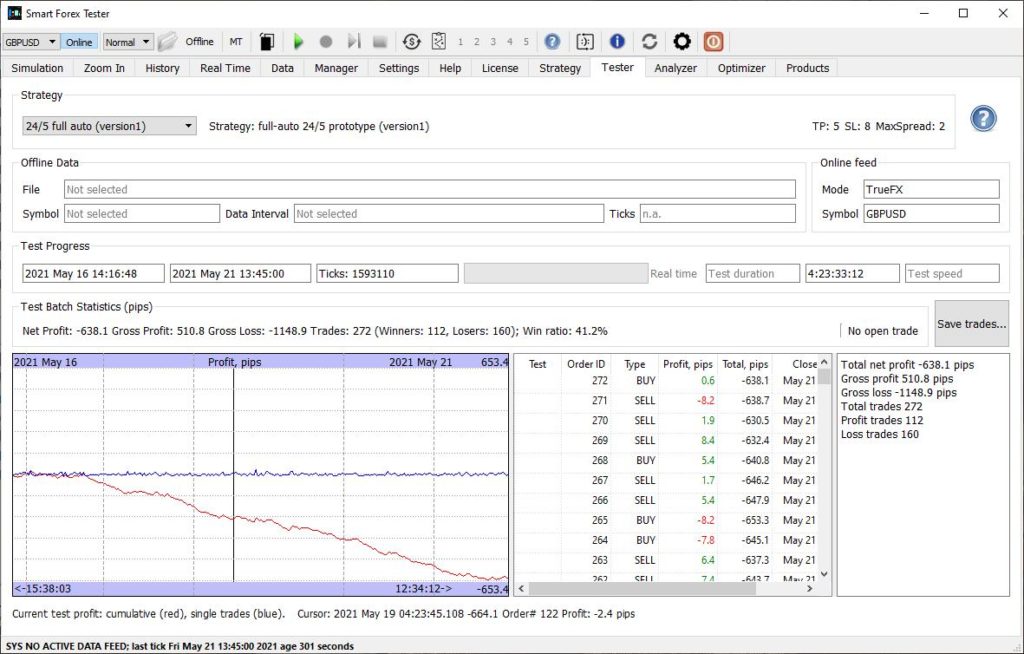
First of all, the strategy just stopped performing after February. Stellar profits turned into consistent losses from March to May. It appears that something changed in the market after February 2021. Was it Brexit?
For the sake of comparison, in the last 3 month, we have been running the same strategy on EURUSD from time to time and the results were absolutely different.
We are not saying our strategy is perfect – quite the opposite. But if the strategy consistently loses in one market – something is just not matching here. Our understanding of this market probably.
On the bright side, we want to point out that with our strategy you can’t lose a lot – the losses come in small increments. So, in real trading – based on experience – we would have stopped trading promptly in the beginning of the week and continued to monitor it in the tester mode – until we saw market changed. Meaning that we definitely wouldn’t have ended up with a thousand pips weekly loss.
However, this is not a very good consolation. We need to make the strategy more robust and we are currently working on it. Read our previous posts for the ideas that we have of how to improve our strategy.
We will be using the saved tick by tick market data for the losing weeks to systematically test the newer versions of the strategy.
Here is May 2021 GBPUSD tick data.
And here’s the total result for the month of May: loss of 1527.3 pips.
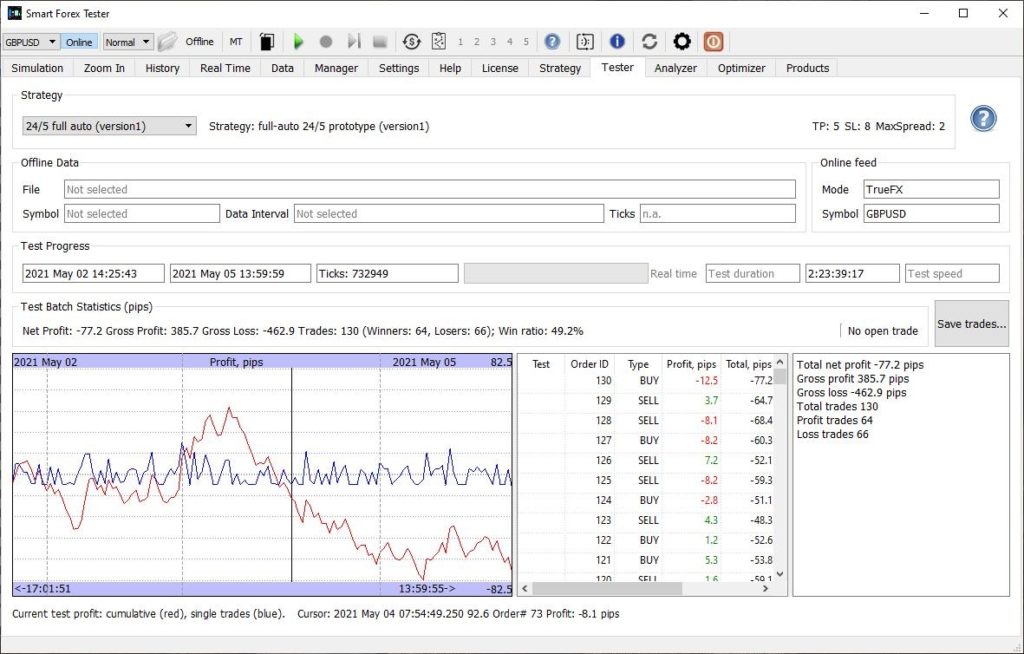
May 2-5. Losses 77.2 pips.
May 5-7. Losses 214.1 pips.
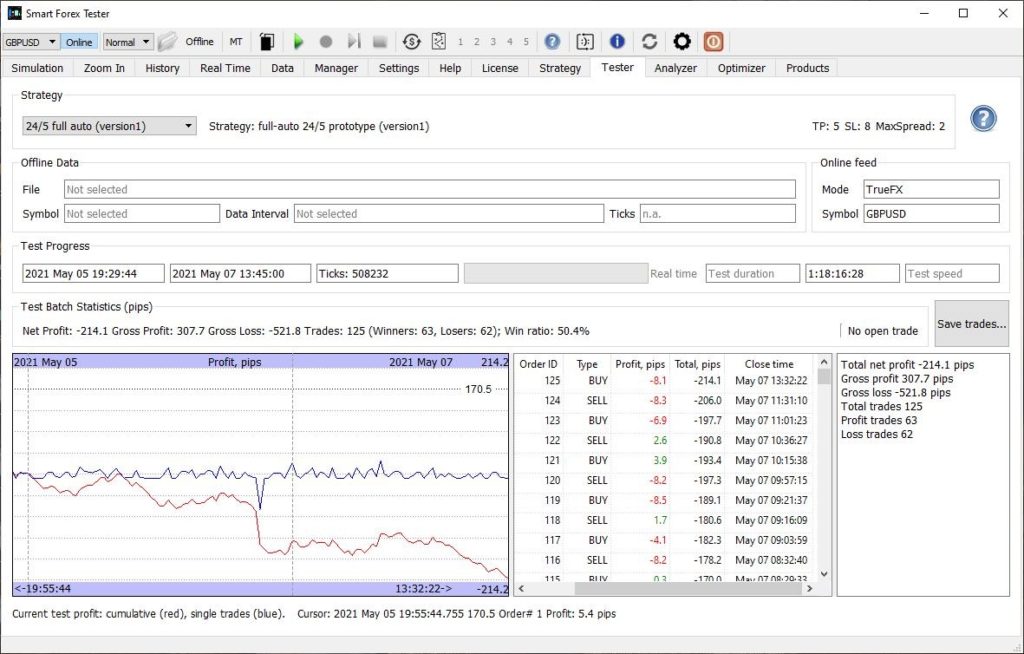
May 5-7 trades. A huge 70 pips loss at NY close is because this strategy runs 24/5 (no scheduler).
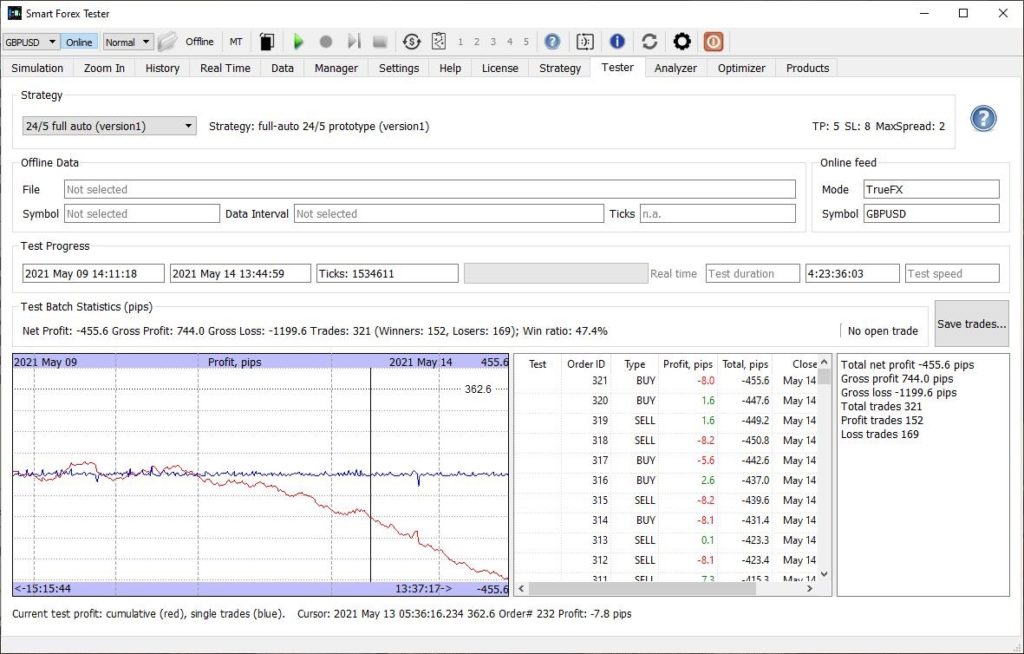
May 9-14. Losses 455.6 pips.
May 16-21. Losses 638.1 pips.
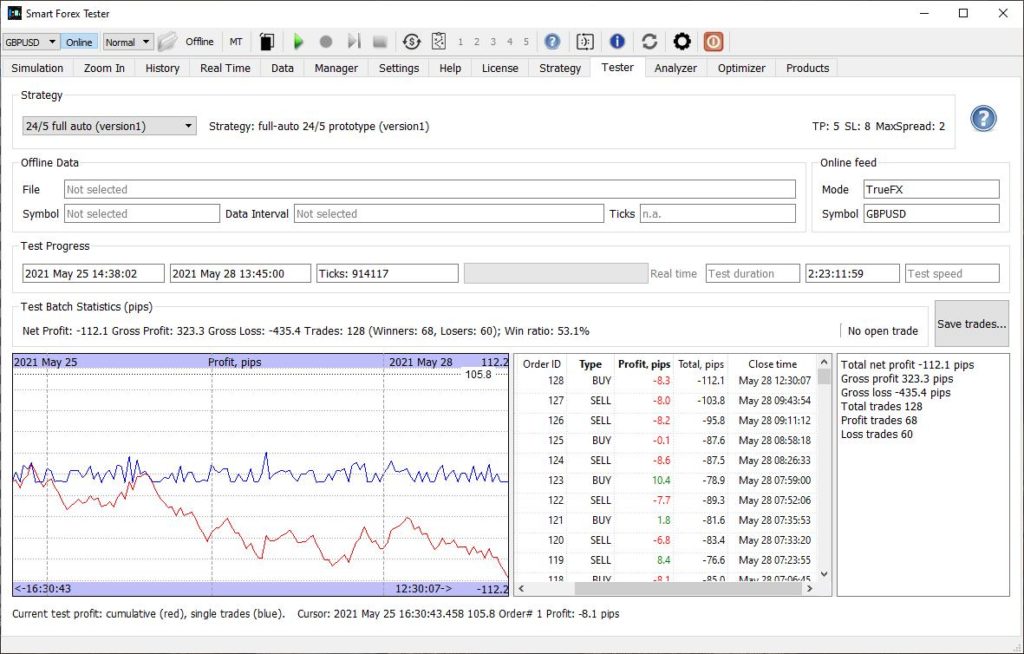
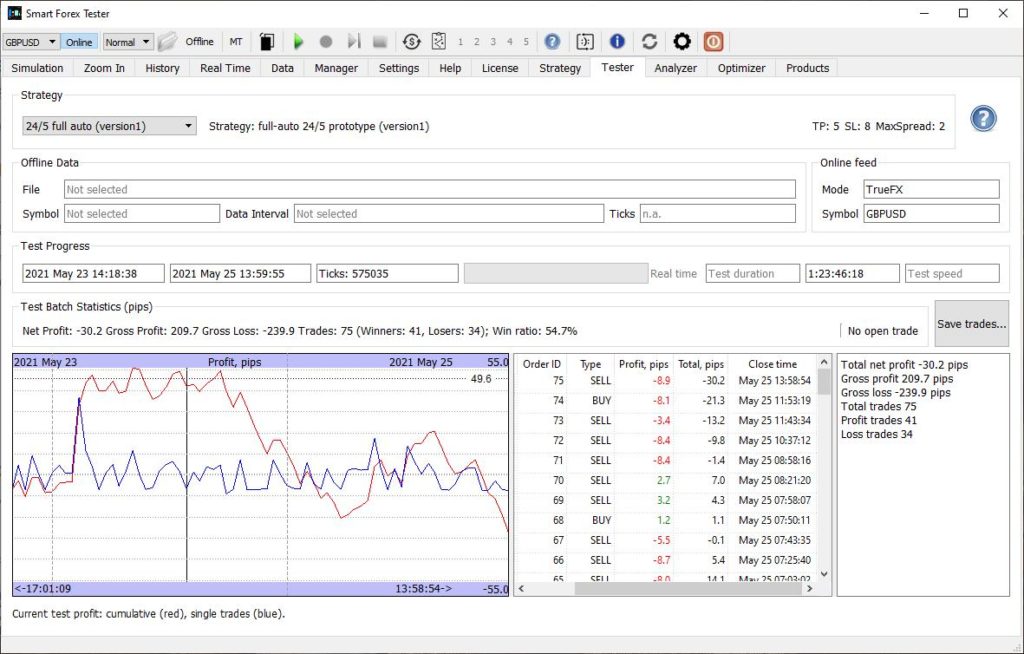
May 23-25. Losses 30.2 pips.
May 25-28. Losses 112.1 pips.
