Sell in May: concluding our 8 month long GBPUSD live test

May was the last month of our continuous live test started in October 2020.

Bottom line: total result is not as spectacular as the beginning (5000+ pips for first 5 month), but still the 8 month test is solidly profitable despite the very simple prototype strategy. How we were testing.

Here is the analysis and conclusions.

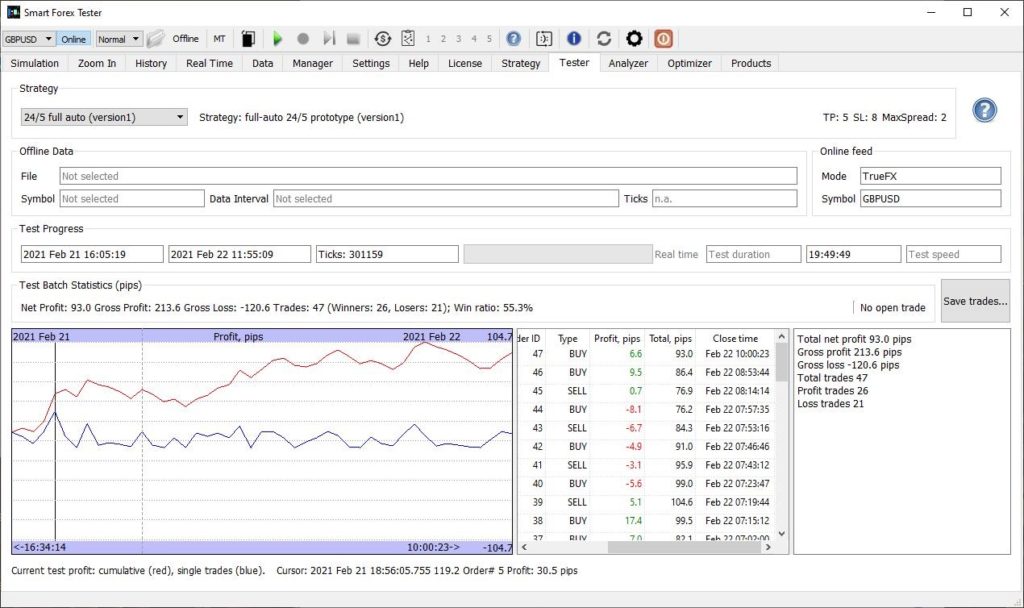
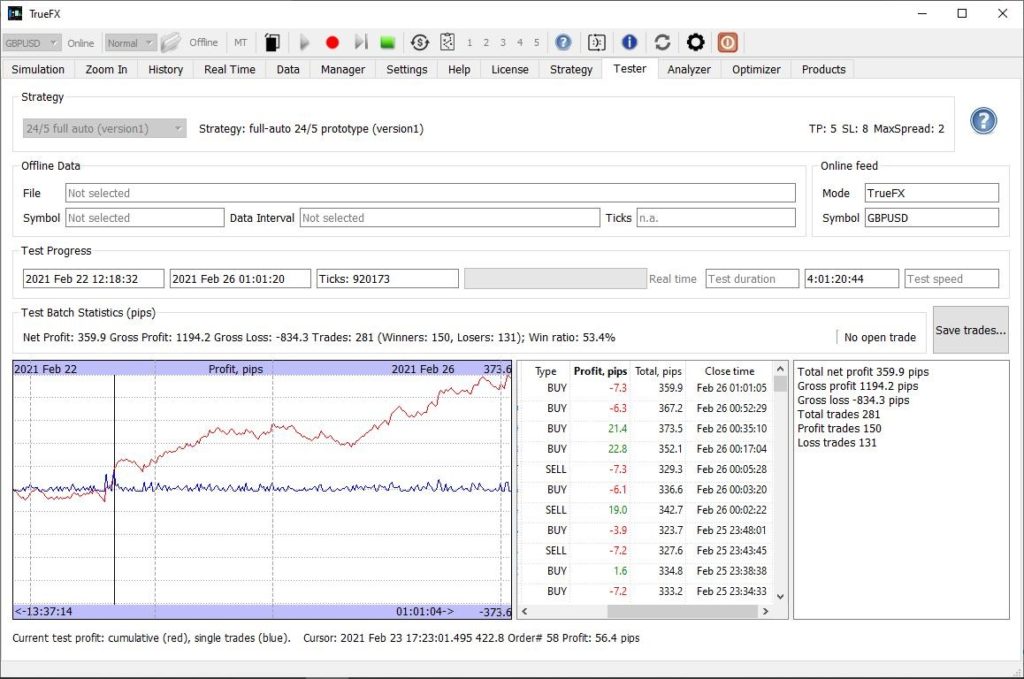
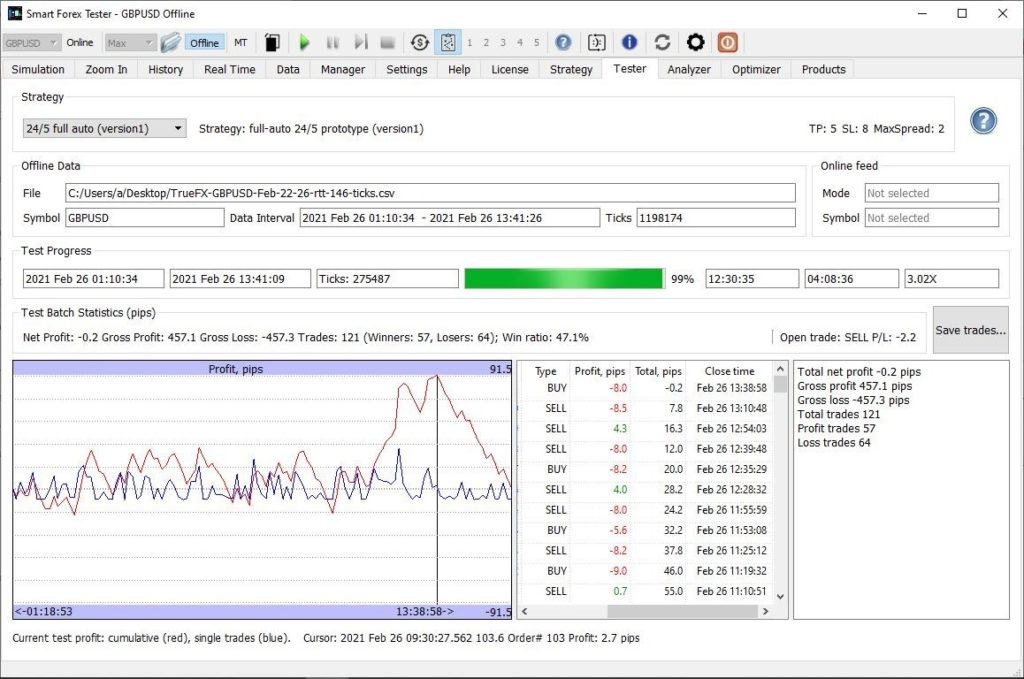
On the surface, the test result is good. The overall profit is over 1100 pips.

Moreover, the profit is actually significantly bigger – because in our simple strategy we didn’t do anything to properly handle the switching between the NA and Asian sessions.

So, if we happened to have an open trade at 5 pm Eastern, when the NA session closes, and spreads soar – the strategy was unable to close the position with the standard SL of 8 pips. Since spreads soar in the matter of literally 1-2 ticks, and as the result, the position closing losses could be in tenth of pips.

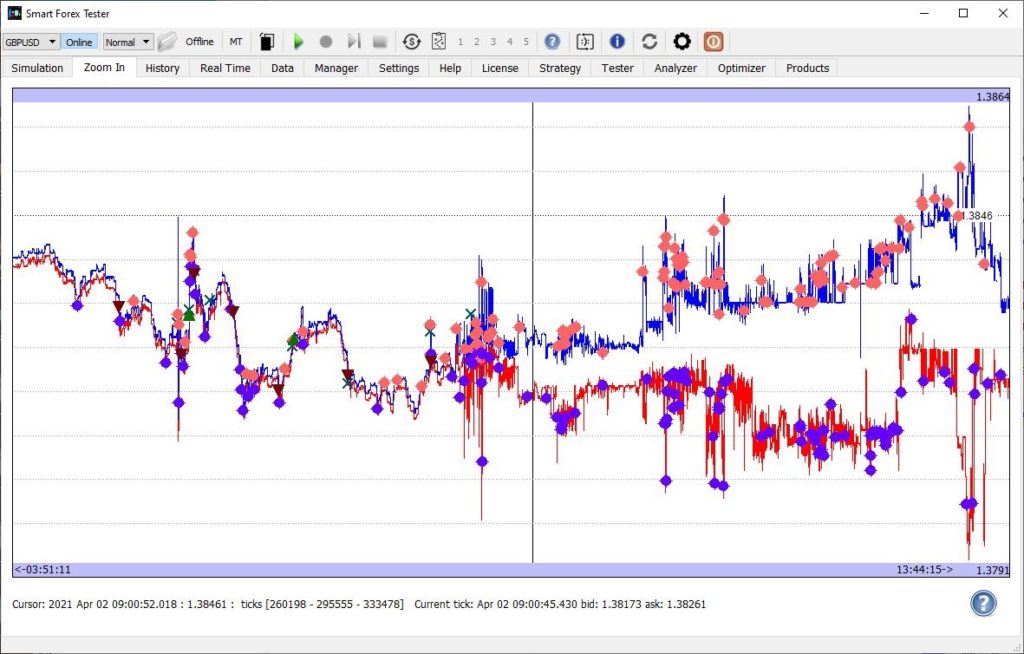
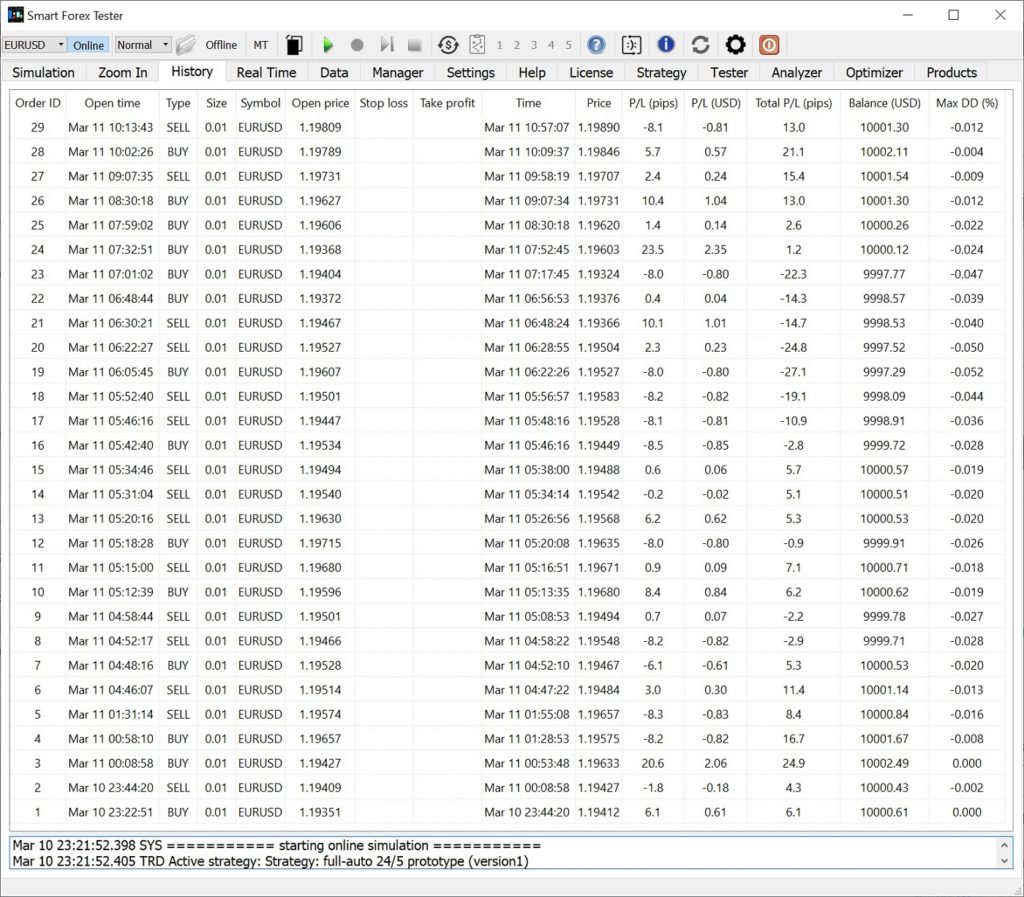
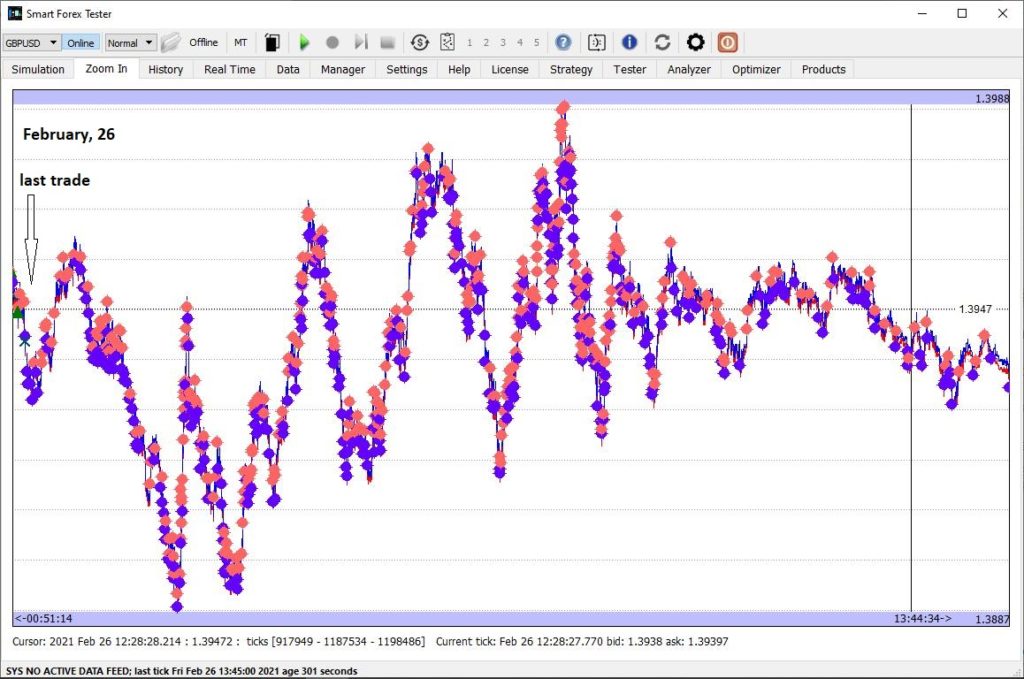
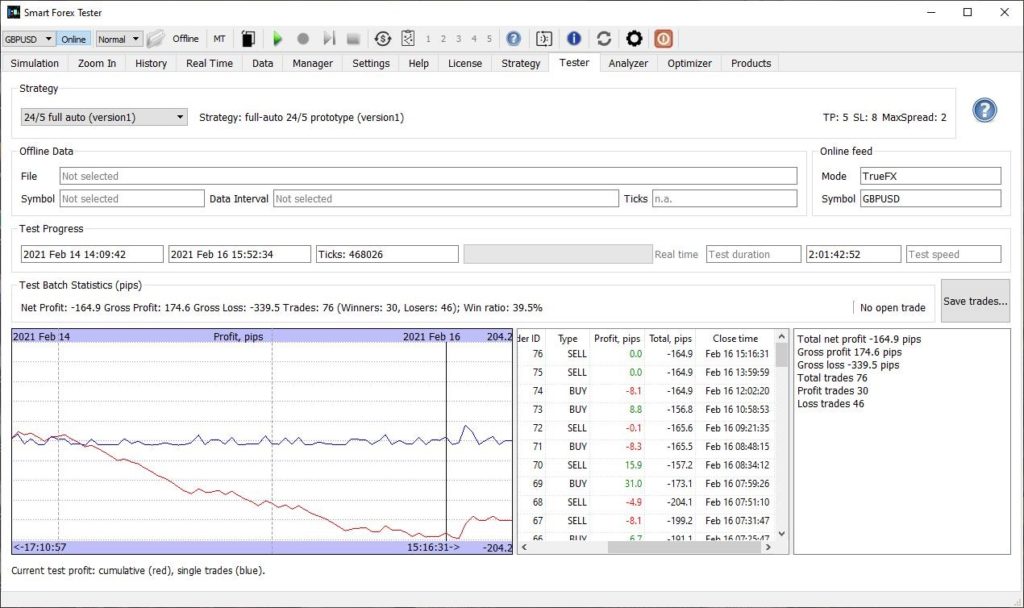
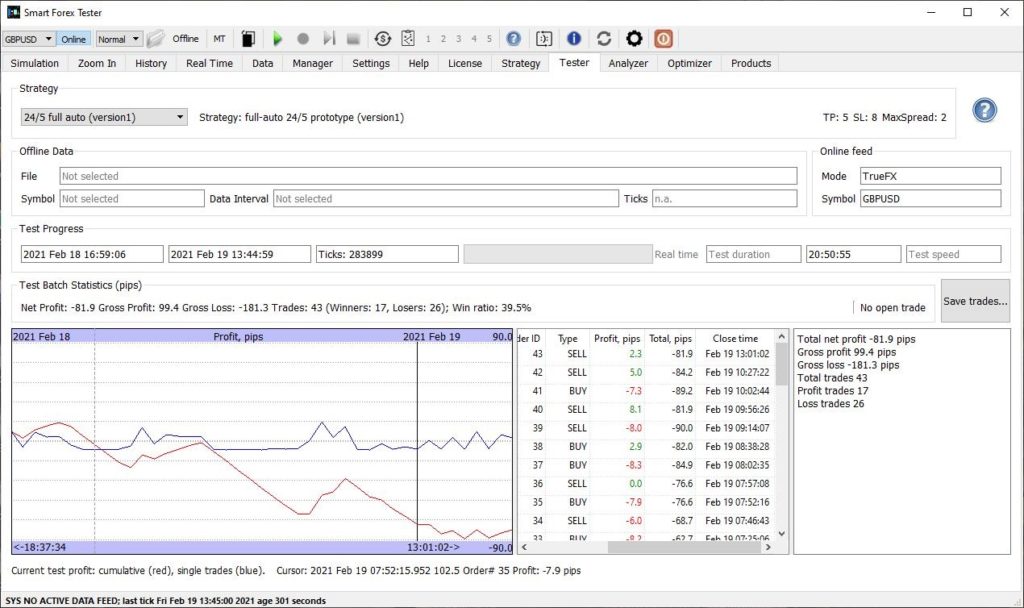
Only one example: on May, 6 the loss was over 70 pips (see the May 5-7 graph below).

This is a known technical issue – it can and should be avoided by just closing the position say 15 min before the NY close.

Furthermore, before we even started testing on a regular basis, in August and September 2020 we had seen similar results – hundreds of pips weekly. We just didn’t start documenting yet since the software was in developer testing mode.

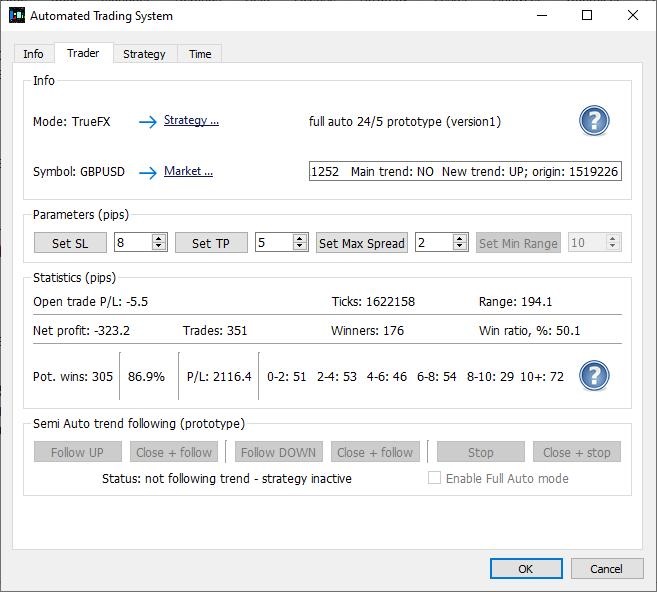
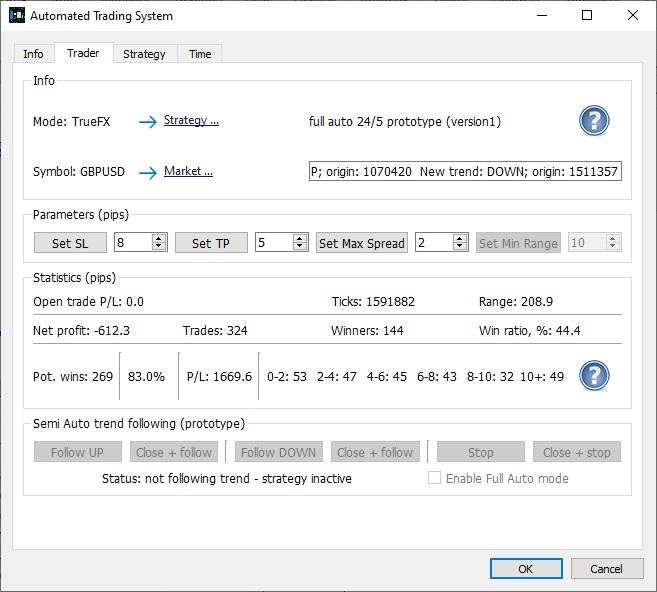
And finally, the strategy we used was a very first prototype with a very simple profit taking logic and static stops. We can definitely do better. And we kept all the strategy parameters unchanged throughout the whole test.

But all that said, we are far from satisfied by the test results.

Here’s why.

First of all, the strategy just stopped performing after February. Stellar profits turned into consistent losses from March to May. It appears that something changed in the market after February 2021. Was it Brexit?

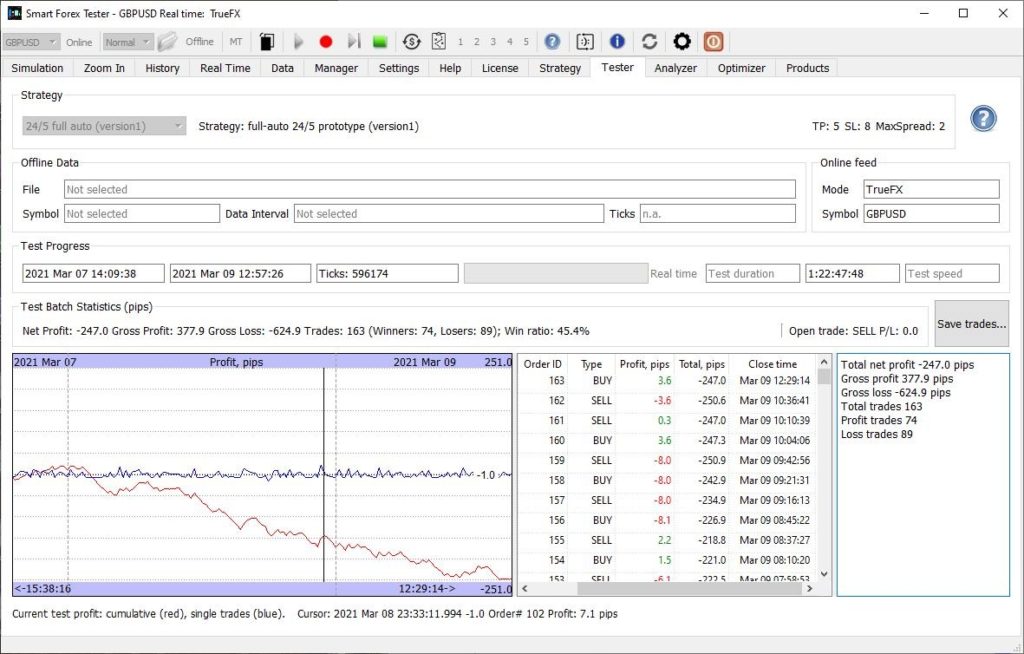
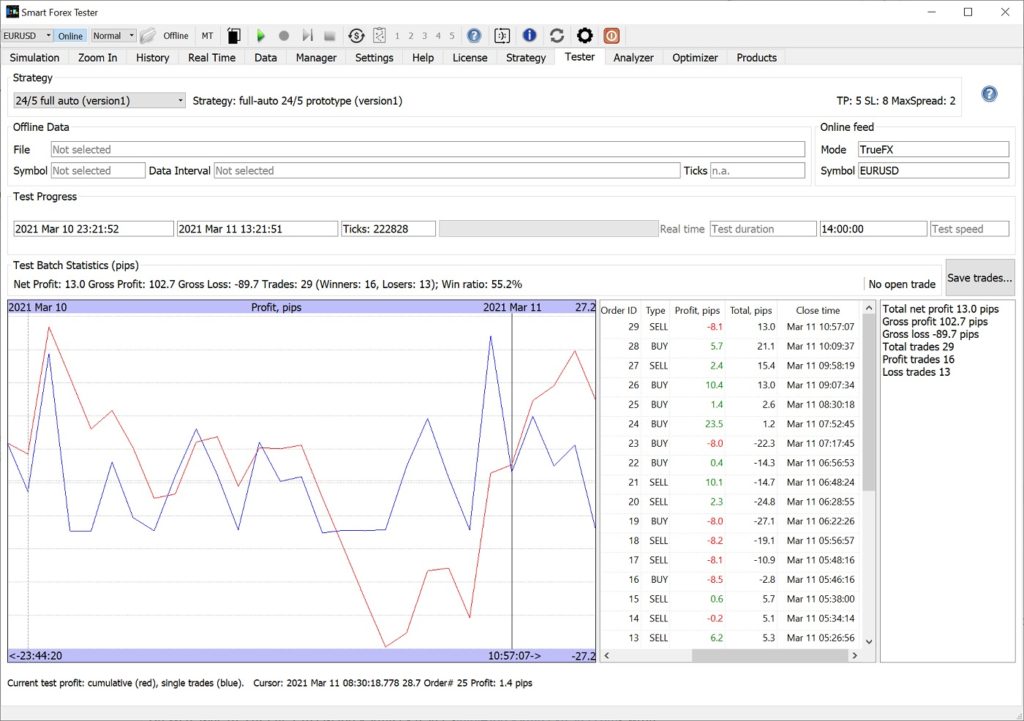
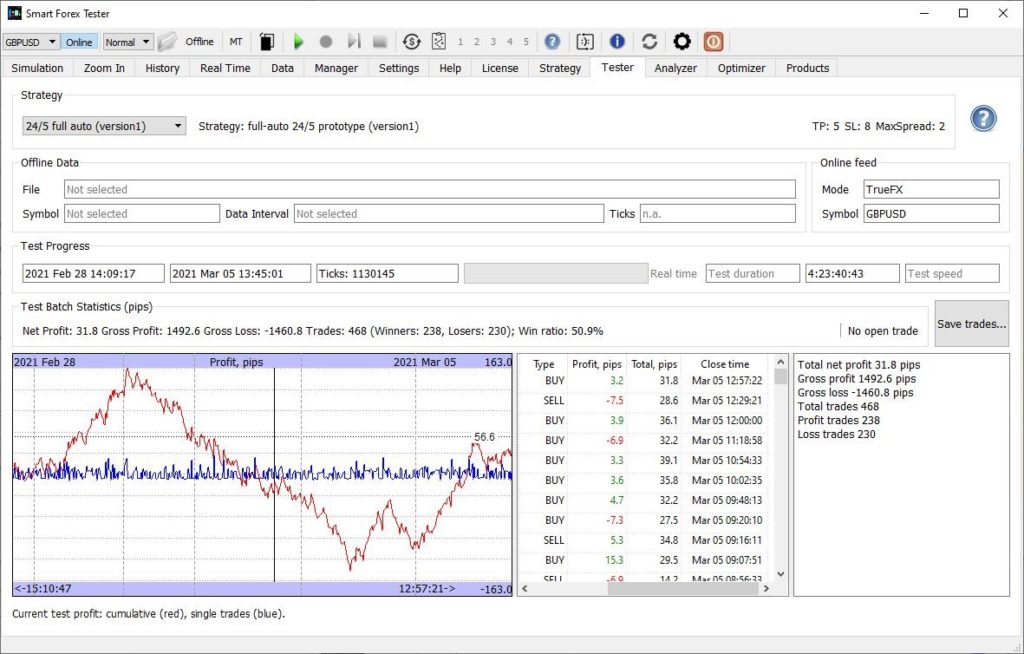
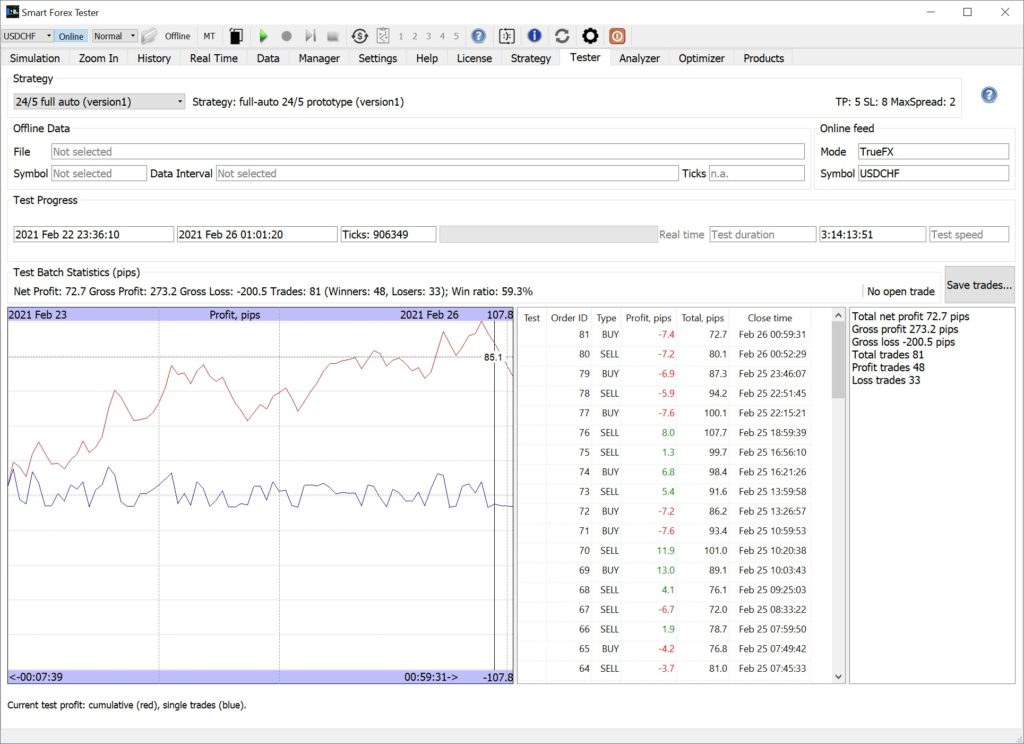
For the sake of comparison, in the last 3 month, we have been running the same strategy on EURUSD from time to time and the results were absolutely different.

We are not saying our strategy is perfect – quite the opposite. But if the strategy consistently loses in one market – something is just not matching here. Our understanding of this market probably.

On the bright side, we want to point out that with our strategy you can’t lose a lot – the losses come in small increments. So, in real trading – based on experience – we would have stopped trading promptly in the beginning of the week and continued to monitor it in the tester mode – until we saw market changed. Meaning that we definitely wouldn’t have ended up with a thousand pips weekly loss.

However, this is not a very good consolation. We need to make the strategy more robust and we are currently working on it. Read our previous posts for the ideas that we have of how to improve our strategy.

We will be using the saved tick by tick market data for the losing weeks to systematically test the newer versions of the strategy.

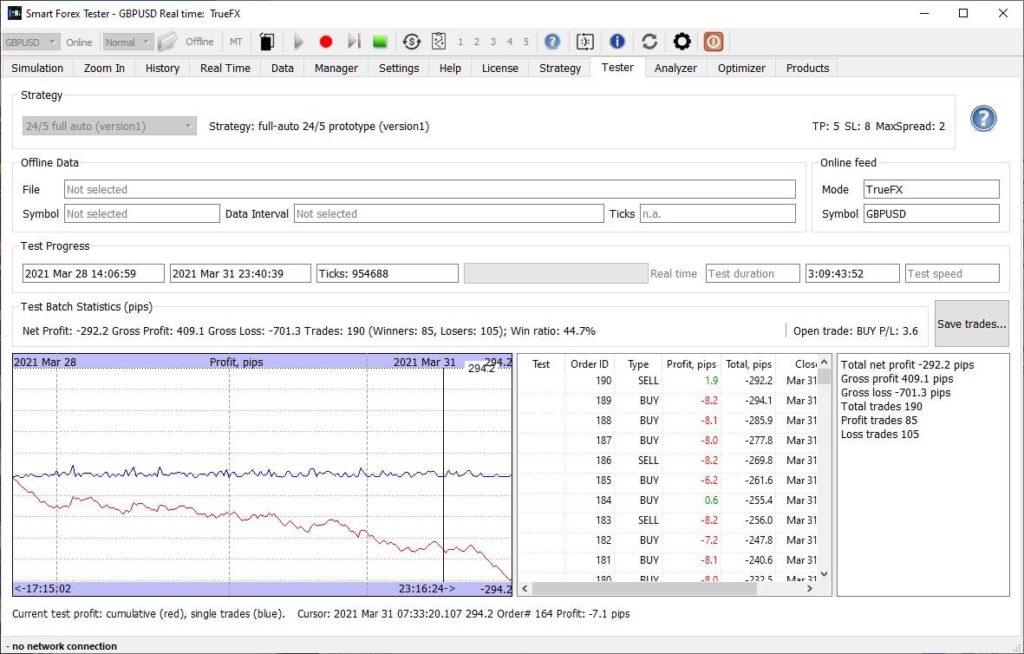
Here is May 2021 GBPUSD tick data.

And here’s the total result for the month of May: loss of 1527.3 pips.

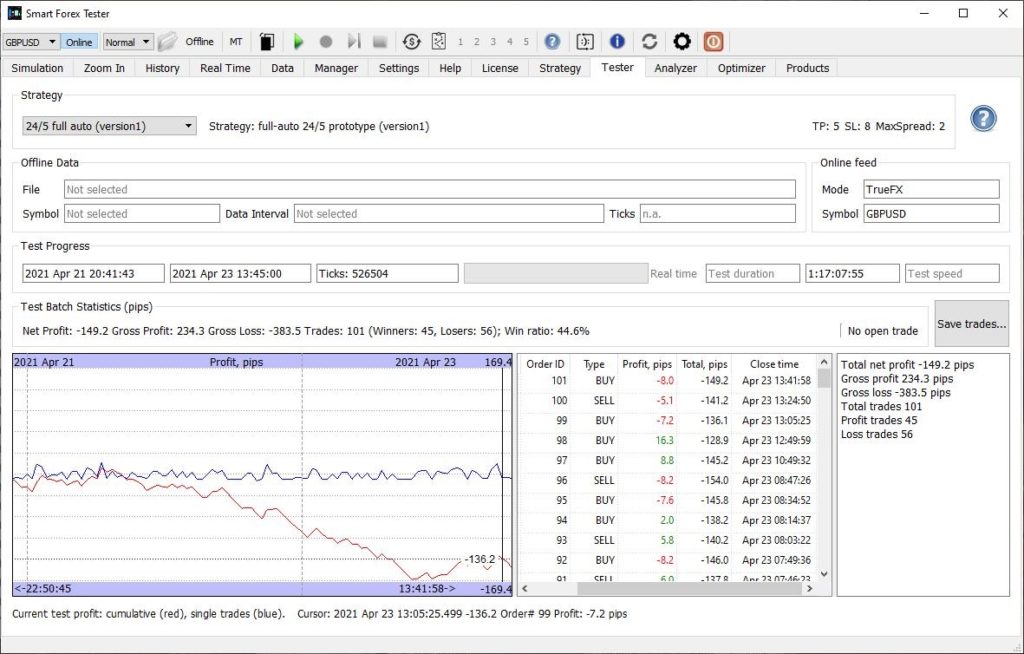
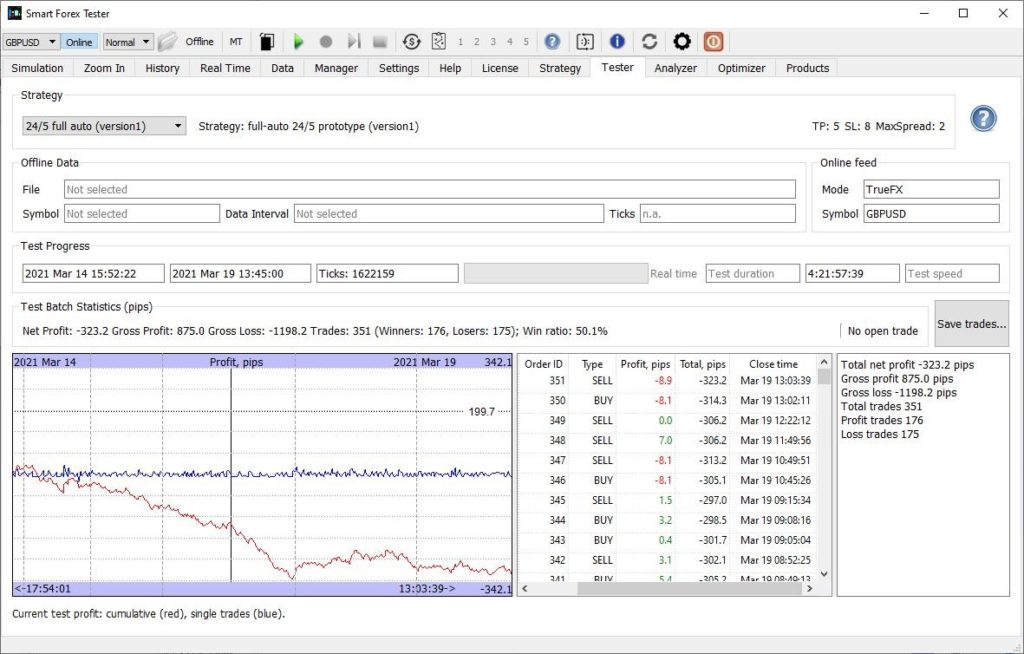
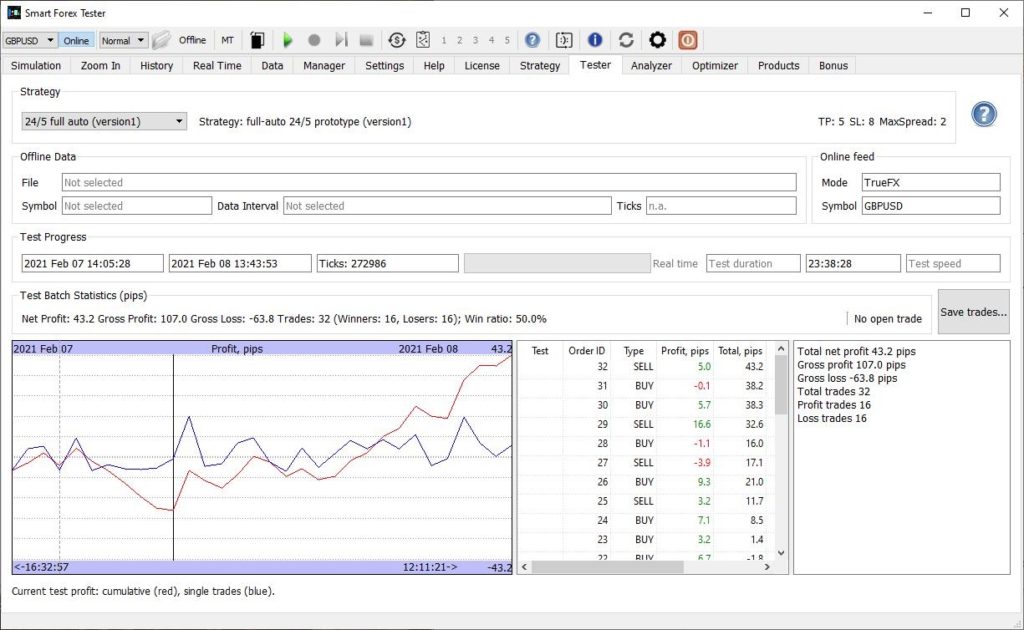
May 2-5. Losses 77.2 pips.

Volatility 144 pips

May 2-5 trades.

May 5-7. Losses 214.1 pips.

Volatility 150 pips

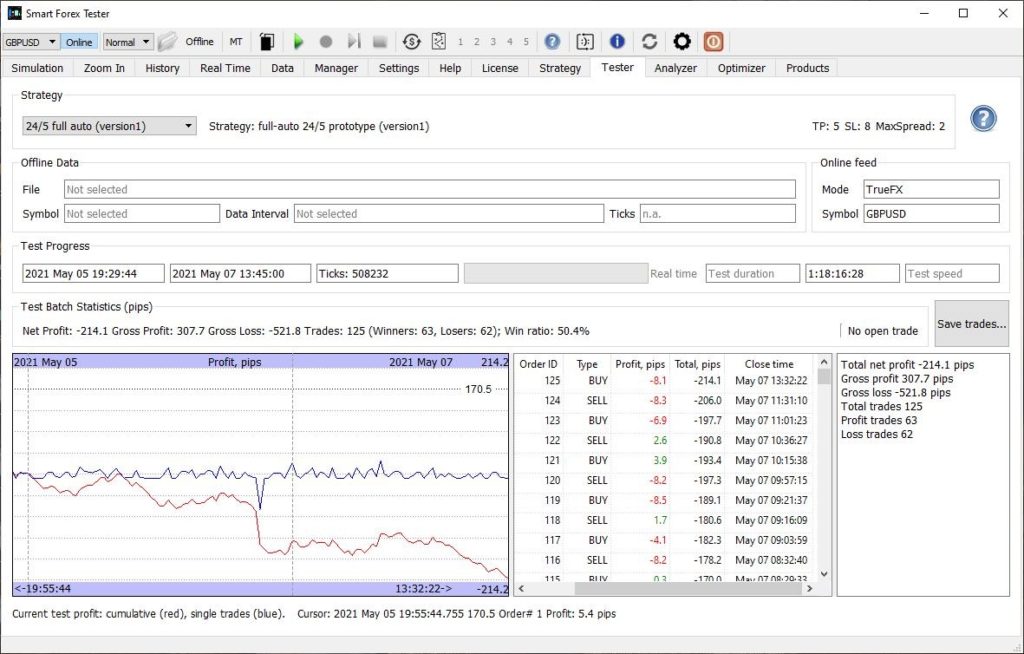
May 5-7 trades. A huge 70 pips loss at NY close is because this strategy runs 24/5 (no scheduler).

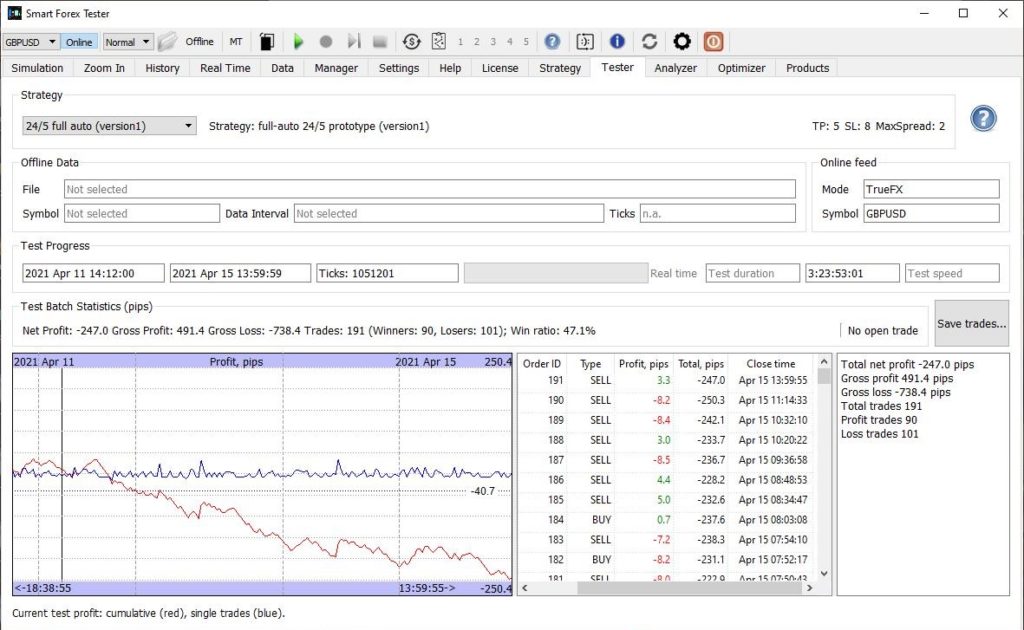
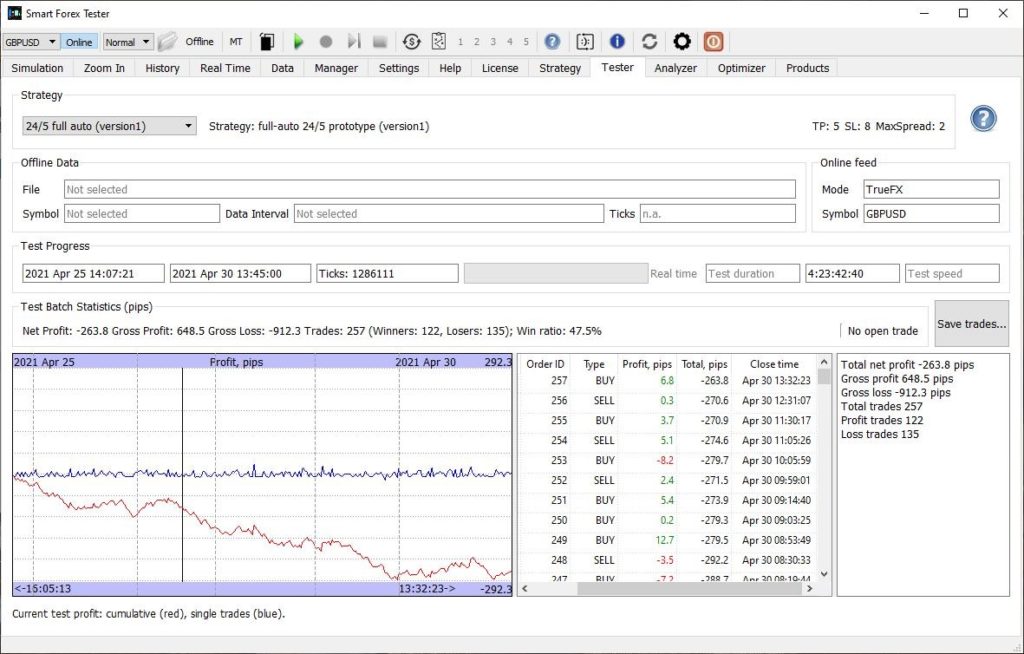
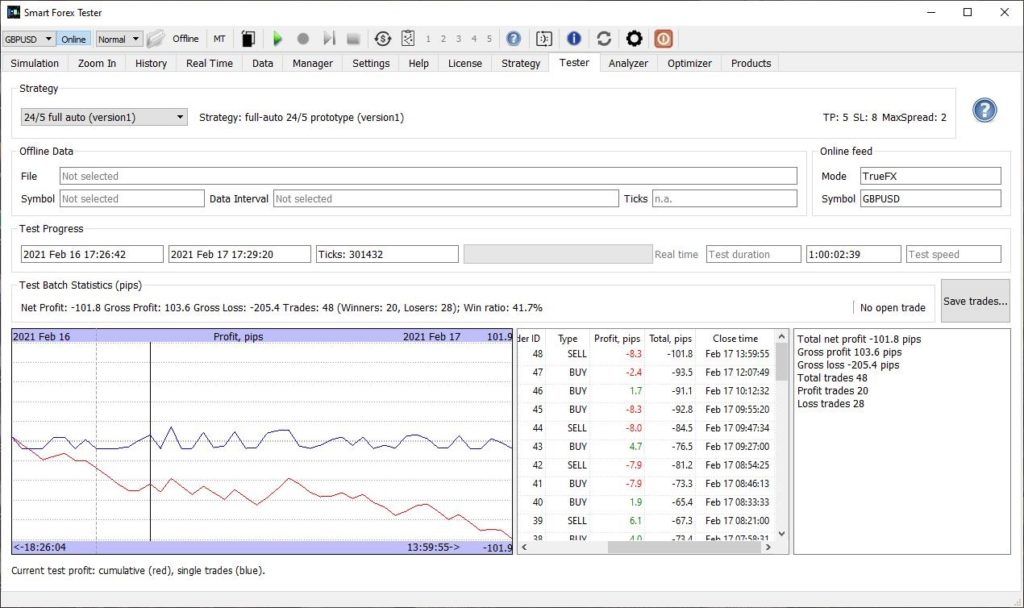
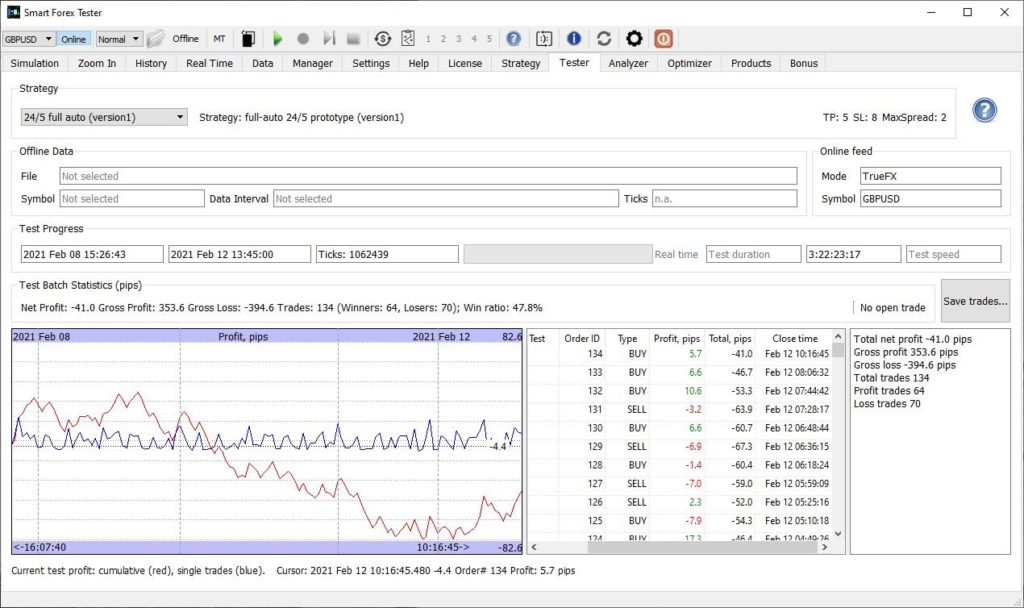
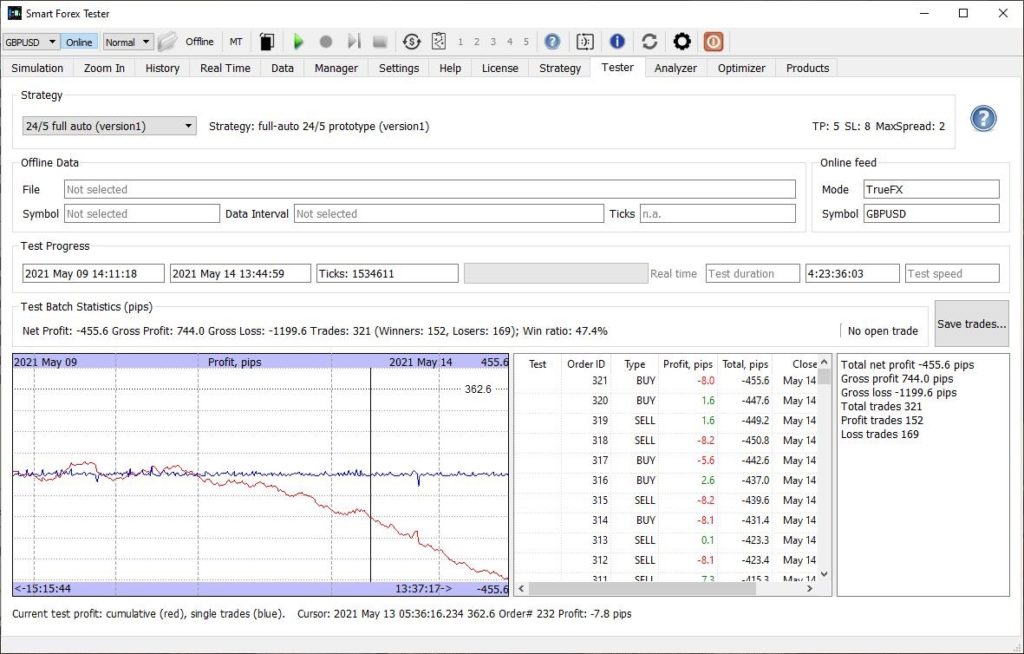
May 9-14. Losses 455.6 pips.

Volatility 232 pips

May 9-14 trades.

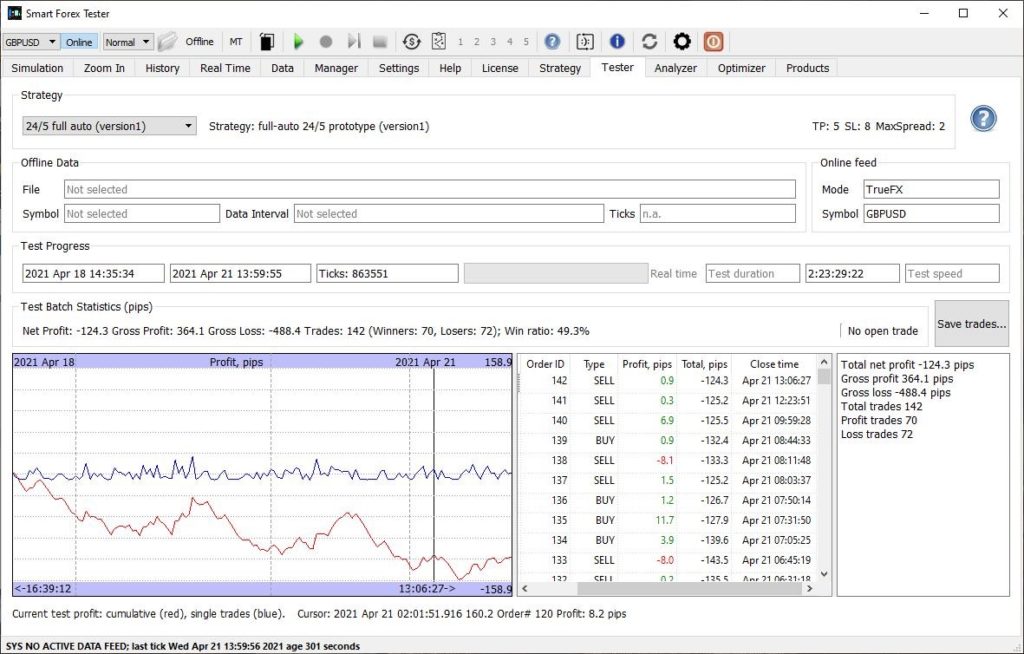
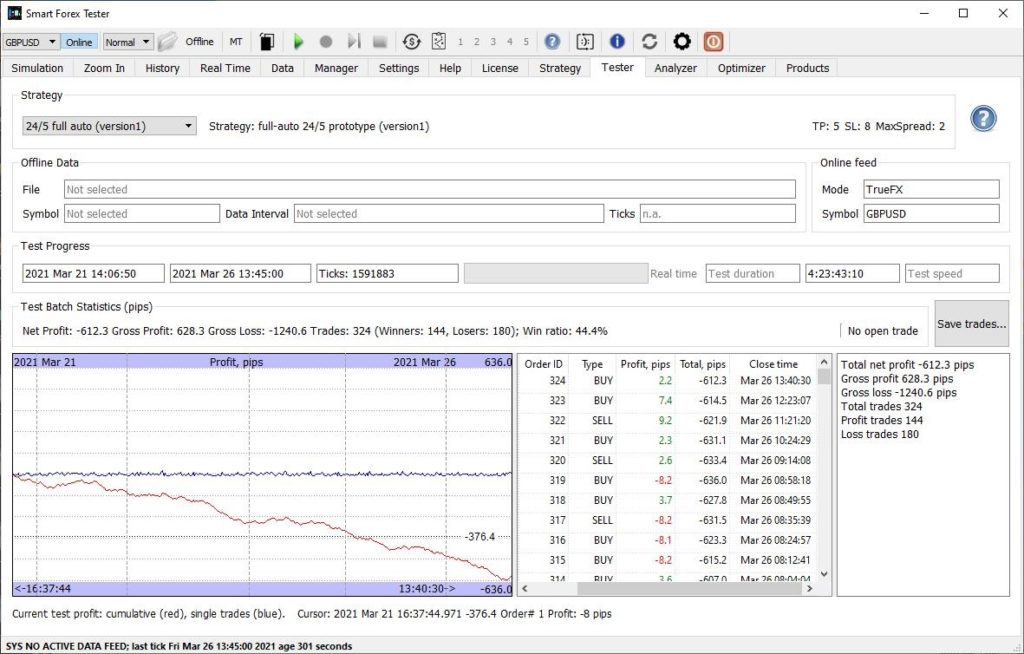
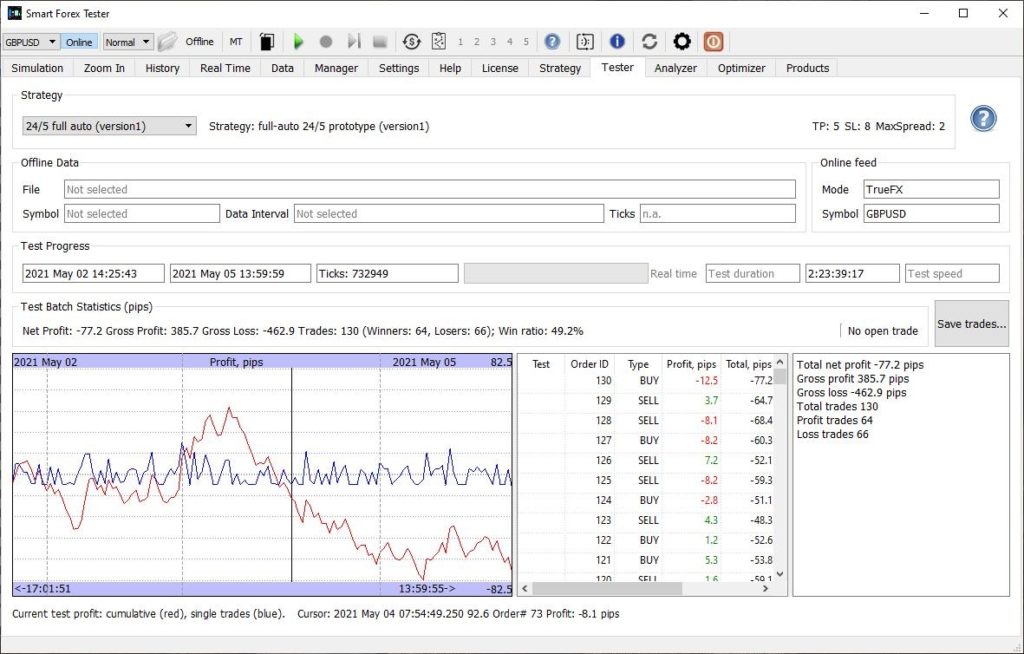
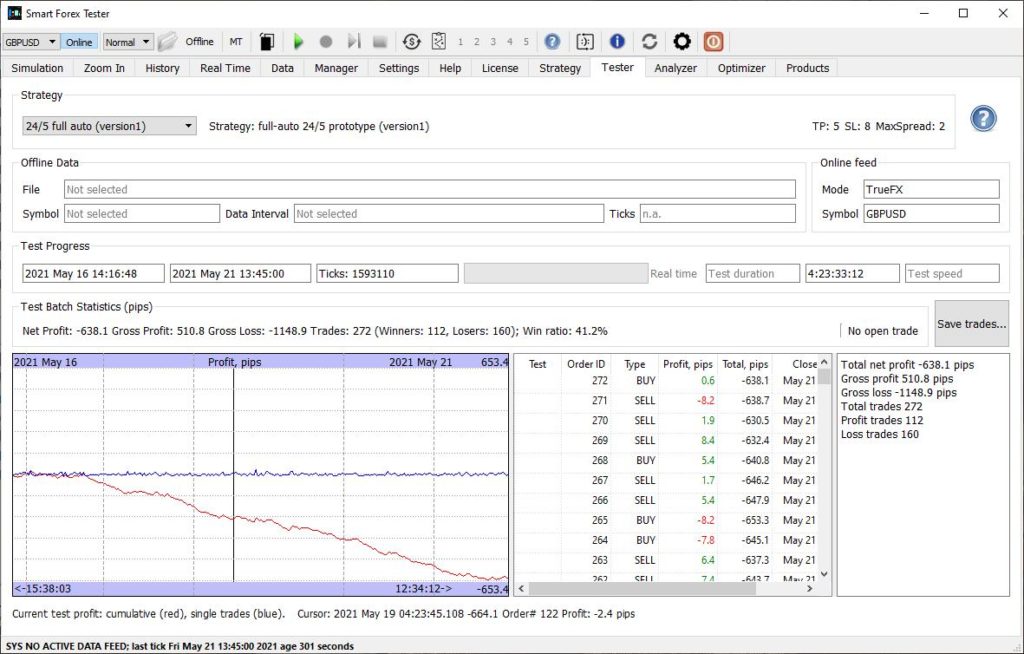
May 16-21. Losses 638.1 pips.

Volatility 158 pips

May 16-21 trades.

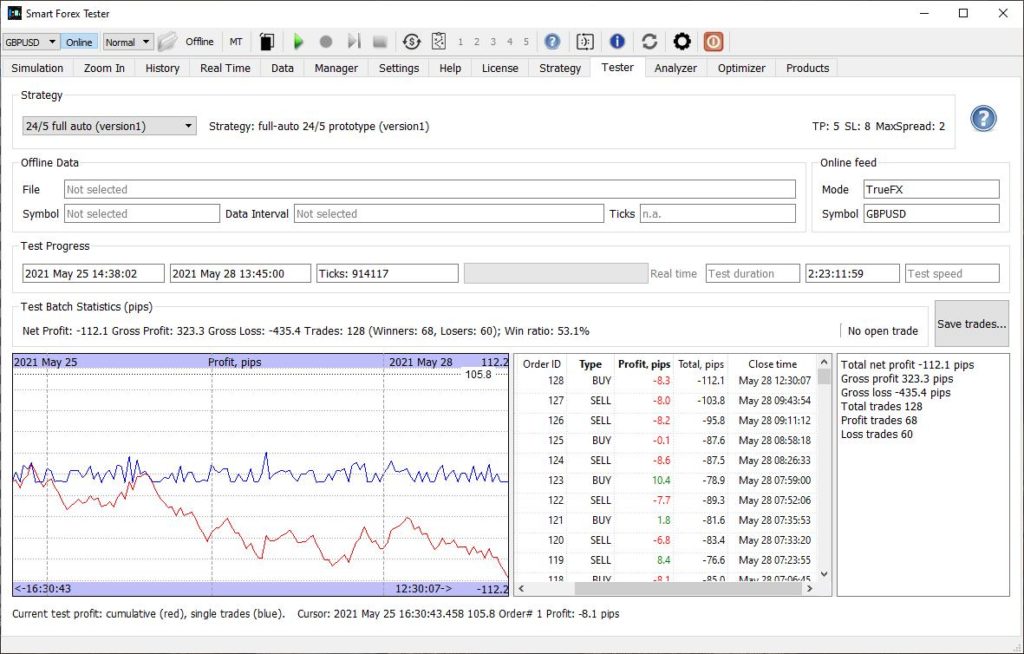
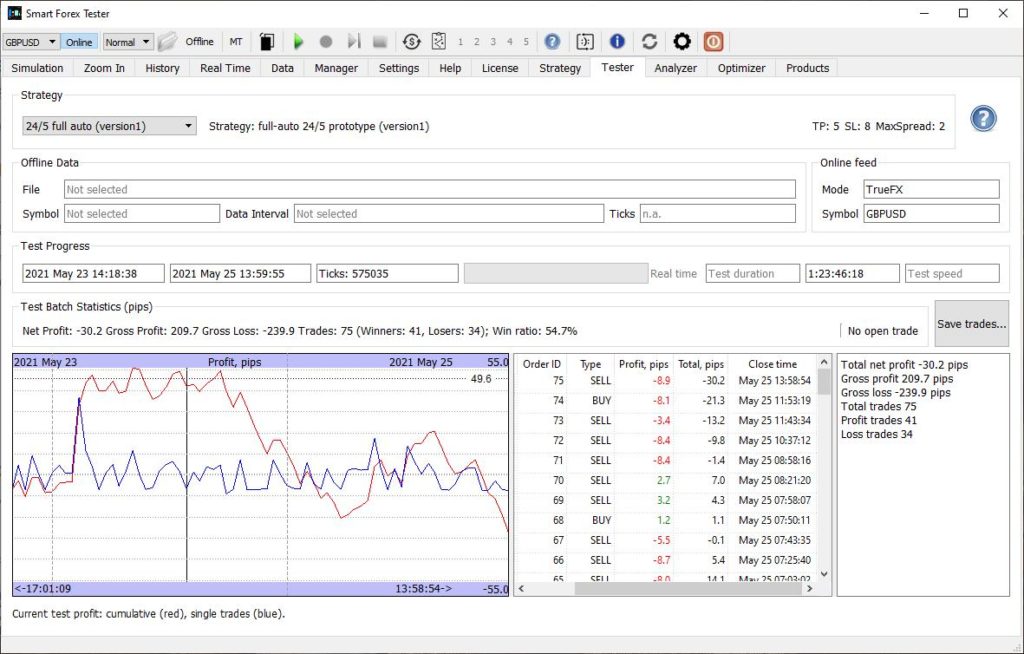
May 23-25. Losses 30.2 pips.

Volatility 101 pips

May 23-25 trades.

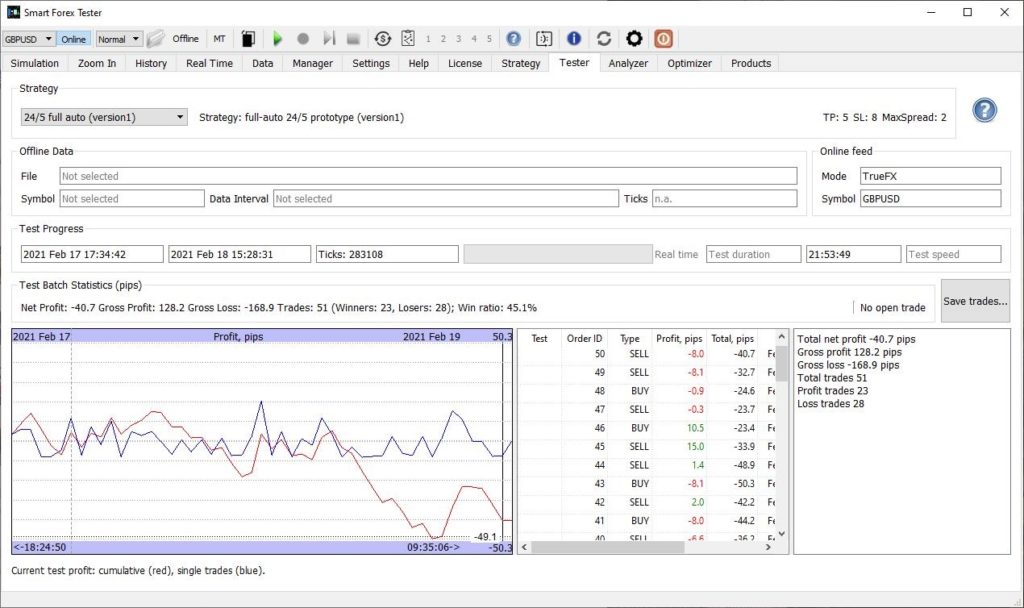
May 25-28. Losses 112.1 pips.

Volatility 130 pips

May 25-28 trades.

April 2021 – Live GPBUSD test

Summary: monthly loss of 922 pips, with all weeks losing.

Analysis: nothing to add to the conclusions of the March report. We will use the saved ticks as test data for the next iterations of our strategy.

Bottom line: overall result after 7 month long testing is still 2000+ pips profit.

Here is April 2021 GBPUSD tick data.

April 1-2. Losses: 129.3 pips

Holy Thursday… Good Friday…

Here’s an example of the price action. The market goes nowhere and spreads are 10s of pips.

No real trading before Easter…

April 1-2 trades.

April 4-9. Losses: 8.6 pips

Treading water after Easter

April 4-9 trades.

April 11-15. Losses: 247 pips

Technical error stopped the test after NY close on Thursday

April 11-15 trades.

April 18-21. Losses: 124.3 pips

Volatility 202 pips

April 18-21 trades.

April 21-23. Losses: 149 pips

Volatility 131 pips

April 21-23 trades.

April 25-30. Losses: 263.8 pips

Volatility 175 pips

April 25-30 trades.

March madness: GBPUSD forward test March 7-26

[We combined the report for 3 weeks into one, since they are pretty similar]

Bottom line: the strategy under test had no chances of turning profit in choppy price action with low volatility. This is known. However, half of the time the win ratio was around 50%. It used to be enough to score hundreds of pips of profit in more volatile markets. But not now – even combined with the highest on record potential win ratio. This stresses once again the need of profit taking algorithm improvement. Which could save the outcome even without switching between the current and the mean reversion strategy that we are developing.

That said, despite whopping 1,675.4 pips losses, this is not the end of the world.
Losses are a part of the game: you can’t always win in the market. And overall, we are still over 3,000 pips up since last October.

In addition, one advantage of our strategies is that they don’t try to bet on a small number of huge wins but are gaining from multiple frequent trades. So, in a real trading, it would be easy to stop and cut losses short.

But since we are sticking to our plan, we keep the test running 24/5 with all the setup unchanged. Later on, we will use the recorded ticks to test all the strategy improvements we are currently working on.

If you want to test yourself, here is the collected tick data for March 2021.

The week March 7-12

The second trading week of March was the worst in the entire 5.5 month long test. In total, our automated trader lost 447 pips.

There were only 3 losing weeks before that – and all had some holidays. This week didn’t present any such excuses. It was clearly visible that the overlapping price action with low volatility was a killer.

First 2 days – volatility 129 pips. Not much chance for the version1 strategy.

Turning 129 pips volatility in 2 days into profit was a nearly impossible mission for the version1 strategy

If you want the details, here is the full trade log.

We had to restart the test to update the software to the latest build.

There is little to add about the rest of the week. Volatility was slightly higher, but price action stays the same, so the trading result didn’t improve.

Volatility 169 pips during 4 days was too low.

If you want more details: here is the full trade log.

The week March 14-19

Low 194 pips volatility – despite the decent tick rate we had similar patterns.

If you want more details: Trade log.

Markets on March 16-17 were too difficult – even overall 50% win ratio didn’t help

Out of curiosity we ran a series of back tests with different strategy parameters. We could cut total losses 3 times.

However, no parameters could cut losses during March 16-17. The price action during these 2 days was “mission impossible” for the used strategy. We will be add these 2 days to our negative test batch.

Interestingly, the strategy failed to turn profit with overall 50% win ratio. With price action we observed in previous 5 month in most cases it was able to take enough on the trend moves to cover the losses on the rangebound market.

But not now, because the price moves were not big ones to gain enough.

Furthermore the potential win ratio was one of the highest that we ever observed: 87%

Record potential wins could not materialize due to inferior profit taking

These percentages combined witness again the profit taking algorithm is leaving a lot of money on the tale. There is a huge potential once we make more “greedy”: trying to take what is available + attempt to re-enter on pullbacks.

Week March 21-26

Basically, no changes. Despite good enough tick rate, low 209 pips volatility and choppy market action lead to similar results.

However, due to low win ratio of only 44% the bottom line is twice worse compared to the previous week (when the win ratio was 50%) and set a new anti-record of 612 pips.

Same pattern as last week, but losses are greater due to lower win ratio

But the potential wins statistics remains basically unchanged.

Very high potential win ratio confirms market entries are flawless but profit taking is not

If you want more details: here is the full trade log.

Week March 28-31

No significant market action before Easter. As a result, low win ratio and losses.

Volatility 142 pips. 955K ticks

Full trade log.

EURUSD March 11: 14 hour forward test on TrueFX feed

With the Cable going nowhere this week, we decided to try Eurodollar for a change. We used the same strategy and parameters as in our continuous 5+ month GBPUSD forward test.

Namely, we used the version1 strategy with TP=5 and SL=8 and MaxSpread=2 pips. PPA parameters were set to 100/100/254/5/15 (top to bottom).

While SL is static in the version1 strategy, TP is not. Once the current profit exceeds the set TP value, the strategy moves the SL level to the breakeven and starts trailing – but slower than the profit grows. This prevents the strategy from closing the trade too early.

The MaxSpread parameter forbids entering the markets if the current spread exceeds the set value.

Below is the test results. The version1 strategy delivered decent 55% win ratio and even for very low 63 pips volatility scored 13 pips of profit.

13 pips in 14 hours is a good result for low 63 pips volatility

This can be attributed to the “clean” price action with big enough up and down moves without much overlapping. This is what the version1 is most suitable for.

Favorable price action – multiple “clean” up and down moves

Even more interesting is the potential wins statistics. At closing of each trade, the software checks if the trade could have been closed with a profit, and logs how many pips we could have won.

We can see that out of 29 trades, we could have closed 27 with profit. Which means the market entries were nearly ideal.

93% of potential wins is an excellent result. Profit taking could have been better.

But the strategy could only win 16 trades – meaning the profit taking logic definitely deserves improvement (which is one of the things we are working on).

If you want to get into details, you can review the trades on the screenshot below. You can also download the full trade log.

Want to replay our test in the offline simulator? Use the tick data file that we recorded.

In case you may want to run a similar forward test yourself, we compiled the step-by-step instruction how to forward test, where we also explained in detail the GUI controls, gauges etc.

If you don’t yet have the software, you can get it here.

32 pips profit on GBPUSD in first week of March

The 1st trading week of March was not easy for our Automated Trader. But it made it again: yet another profitable week in our forward test that has gained over 5,000 pips in the test running since October 2020.

The Cable was not traded very actively this week. We can see that our trader only received 1.13M ticks. We’ve seen this number reaching 1.5M during more volatile weeks.

The trading results are shown on the below screenshot.

32 pips profit is a good result for low volatility and less than average tick rate

If you want to dig deeper, here is the full trade log.

Note that the “potential wins” exceeded 82%, which is even better statistics than usual. Confirming once again that our PPA based market entry signals as such are excellent.

Almost 83% potential wins confirms lot of see-sawing when no profit is taken

Also this statistics witnesses that the market was choppy with not big enough up- and down moves.

Because our version1 strategy is only starting trailing once the current profit exceeds the TP value, which has been 5 pips during the whole test.

So, if the trade profit reached 4.9 pips or less, and then the market reversed, this trade would become a loser. And there were 150 such trades!

Another explanation for this week result that we can think of is some performance issue in our test bed.

For some yet unknown reason, the average RTT that used to be around 100ms now was 190 ms.

Meaning that the trader could fetch up to 70% less ticks from the TrueFX server than it used to. Which definitely influenced the ability of the trader to react to the market moves.

Due to yet unknown issue, the RTT deteriorated: 194 ms instead of usual 110 ms.

We are investigating what caused the issue. But one thing is clear – the strategy turned out to be resilient to this, which is good.

USDCHF forward test

We have just posted the report about our forward test on GBPUSD that we have been running since October 2020, which it was performing amazingly well – delivering over 5,000 pips during this time.

In addition to this main long-term test we decided to try the same strategy on different currency pairs and picked USDCHF.

First, we’ve run it for 3 days starting February, 22. The result was just excellent: even for the volatility considerably lower than in our main test, win ratio almost reached 60%. We haven’t see it this high in our GBPUSD test.

Excellent win ratio for just 149 pips volatility

If you want to dig into details, here is the full trade log.

We continued the test next week.

5,000+ pips in 5-month 24/5 GBPUSD forward test

February 2021 was not an easy month for our Automated Trader. But we made it again: overall monthly gain exceeded 450 pips. In total, the result of our continuous test that started in October 2020 is now over 5,000 pips profit.

In February, half of the month was wasted: one week was losing, and one week yielded about zero result. However, 2 other weeks saved the situation. Here is the breakdown.

1st week (1-5): 418 pips profit.

2nd week (7-12): 2 pips profit.

3rd week (14-19): 390 pips loss. An outlier in the entire 5 month long test. Before this week, we only had weekly losses twice – and they were negligible: 15 pips during the New Year week and 27 pips during the Thanksgiving week.

4th week: (21-26): 453 pips profit.

And here are the previous results. (Interested in details? Check out how we test).

January 2021: 370 pips monthly profit. Not an exceptional result, but every week was profitable.

December 2020: a stellar month with total profit exceeding 2,000 pips, including 919 pips during the Christmas week alone. Each and every week was profitable again.

November 2020: a profitable month again where we won slightly over 1,000 pips. Only the Thanksgiving week resulted in small 27 pips loss; all other weeks were profitable.

October 2020: weeks 1,2 and 4 were all profitable and in total yielded over 1,200 pips. Week 4 alone yielded 421 pips profit. We had to skip the test during the 3rd week, but a single week could have hardly spoiled monthly profitability.

453 pips a week in GBPUSD forward test: February 21-26

This week volatility finally returned to the Cable. And our strategy started faring so much better than during the previous week. Overall, we won the pips amount roughly equal to volatility.

Even for the relatively slow Sunday-Monday trading with only 106 pips volatility, the win ratio exceeded 55%!

Favorable price action resulted in excellent win ratio (55%) – even for low volatility (106 pips)

The win ratio this high is a comfort zone for our strategy. As a result, it easily gained 93 pips in about 20 hours – with a smooth equity curve.

If you want details, here is the full trade log.

We restarted the test for a 20 minute technical break. Then the test was running non-stop until the end of the trading on Friday, 26.

During the rest of the test the win ratio dropped a bit to 53%. However, this is a very comfortable value as well. Combined with high 358 pips volatility, the total result was guaranteed.

Same pattern continued for the rest of the week. Win ratio 53%, volatility 358 pips, profit 360 pips.

The strategy won 360 pips in 4 days – an excellent result. Especially if you consider smooth equity curve with little drawdown. Here is the full trade log.

On the last trading day, we had a software problem. As you may notice, the automated trader stopped functioning in the middle of London trading session (last trade’s time stamp is 01:01:05 – which is ~9am GMT).

The reason for the failure was a lengthy network outage – and the Trader couldn’t fully recover from that.

However, the rest of the software was not impacted by the outage and continued receiving the ticks and recording them when the network connection recovered.

Let’s review the price action during the last hours of Friday trading.

Volatility 100 pips and “clean” up/down moves – the best setup for our strategy

For about 8 hours after the last trade, we observe several “clean” and decent sized up/down moves. These are the best setups for our current strategy to gain.

On the flip side, there are multiple periods of see-sawing, especially closer to the end of the NY trading, where we can also see notably lower volatility. This choppy and overlapping price action price action usually results in losses.

So, we can assume that if the Trader continued to work properly after the network outage, the total profit would probably have not grown very much. But it shouldn’t have decreased much, either.

Fortunately, we don’t have to guess. Since we have all the ticks recorded, we can simply run run the same test in our Offline Simulator, which provides 100% market modelling accuracy.

The below screenshot confirms the result was predictable.

Starting 12.30PM EST, we gave away all gains due to low volatility and see-sawing

In the beginning, the strategy nicely used the big moves and was up almost the same as volatility (106 pips for this period). Only to give away all gains in the last ~4 hours of the NY trading session, when the market started treading water.

GBPUSD forward test – a rare losing week (February 14-19)

The President Day week turned out to be a disaster.

Our automated strategy lost 390 pips. There were no winning days. The win ratio was lowest on record and at times fell below 40%. That said, we are still up on in February – thanks to the nice 400+ pips gain during the 1st week!

This was the first such a serious blow to our strategy during the whole test that we have been running since October 2020. (See how we test).

Before this week, in the entire 5 month long test, we had only 2 losing weeks. First, we lost 15 pips during the New Year week. And the other time was when we lost 27 pips during the Thanksgiving week.

We intentionally run our test 24/5. But in real trading, holiday weeks should probably be skipped.

That said, the Christmas week was an exception when we scored a massive 900+ pips profit.

Here is the profit development from the beginning of the trading thru Tuesday NY session (Monday was the President Day holiday in the U.S.).

Win ratio below 40% is terrible. No chances.

If you want to see the details, here is the full trade log.

Quick analysis shows that the price action was very unfavorable for our trend-biased automated strategy. While the overall volatility for these 48 hours was 129 pips, for the most part it was too low.

The below graph shows an example. Only 20 pips range for 15 hours is extremely rare.

Trading virtually stopped during US President Day: volatility of only 20 pips for 15 hours.

We restarted the test and kept it running for the next 24 hours. Full trade log.

Same pattern as above. No more to say

The test was again restarted and ran for another 21 hours. Full trade log.

Slightly better win ratio helped keep losses reasonable. 45% is close to the breakeven for this strategy.

And here is the graph for the last 20 hours. Full trade log.

No chances again for volatility of 86 pips. Win ratio below 40% is unsustainable

While this week is definitely an outlier in our nearly 5 month test, it shows again we need to make the strategy more robust.

Good news is that we have already started testing the first version of mean reversion algorithm. Next step is the switching logic that would select the most relevant strategy based on the current market conditions.

And let’s see how the last week of February goes. So far we are winning a little on a monthly basis. And based on our previous statistics, we are optimistic that we will have 5th profitable month in a row.

A zero week in GBPUSD forward test (February 7-12)

Compared to the great previous week where our Trader yielded 418 pips, this week was rather bleak – total result is only 2.2 pips profit.

However, given the lack of market action, we can consider this result decent – for a trend-oriented strategy that we are forward testing. (See how we test).

The beginning of the week yielded 43 pips profit and win ratio of 50%. Which is a very good result given the extremely low volatility of only 80 pips.

43 pips profit is a solid result for that low volatility (80 pips)

After initial drawdown of about 20 pips in the first half of Monday European trading, the strategy nicely recovered losses and steadily gained over 60 pips.

If you want more details, check out the full trade log.

We had to stop the test just before the end of the Tuesday NY session. We resumed the test after about 1.5 hours (which was wasted time anyway from trading prospective) and kept it running uninterrupted during the rest of the week.

Low volatility again (130 pips). Win ratio of 47% is too low for the breakeven

End of Monday went very well – the strategy won additional 30 pips in a nice steady manner. Tuesday was a calm day with almost no action.

Then difficult times started. During Wednesday and Thursday we lost almost 100 pips in the same steady pattern. One of very rare cases of a big drawdown.

Friday was an up day with almost 40 pips gain.

Full trade log for the second part of the test.