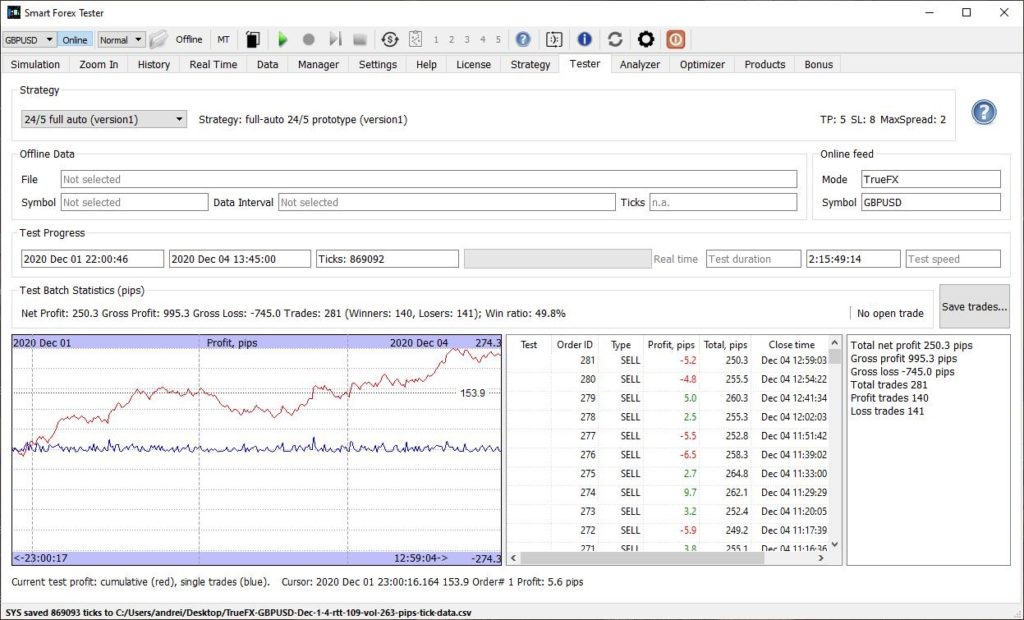
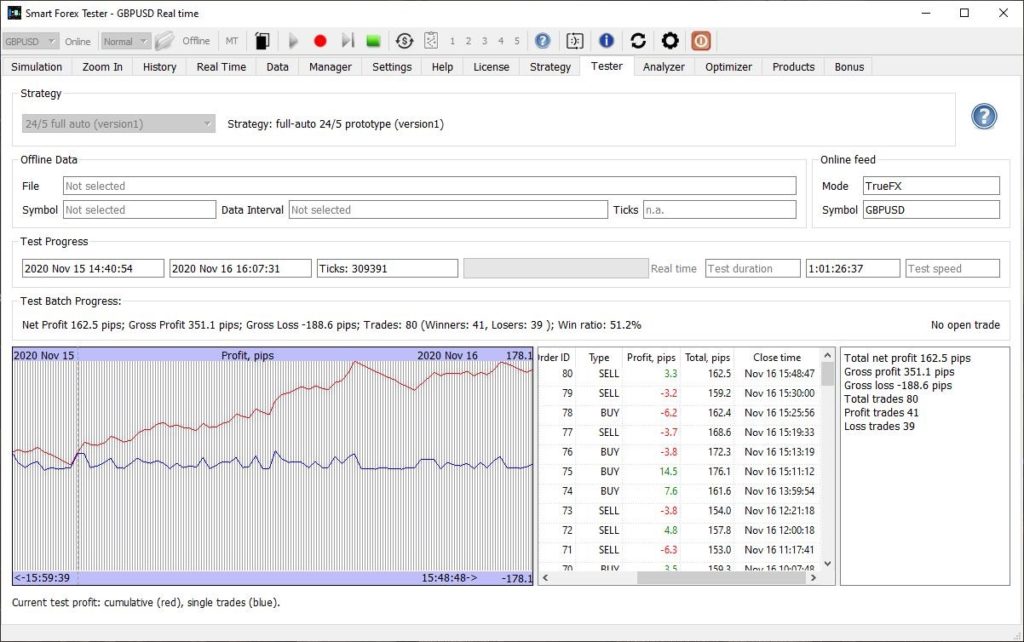
We continued our testing during the trading week of November 29 – December 4. Again, our automated trading strategy showed smooth profit growth and stable win ratio with low draw-down. There were no losing days.
We were testing our automated trader on GBPUSD data feed by TrueFX . Read our previous report for the details of how we did our testing.
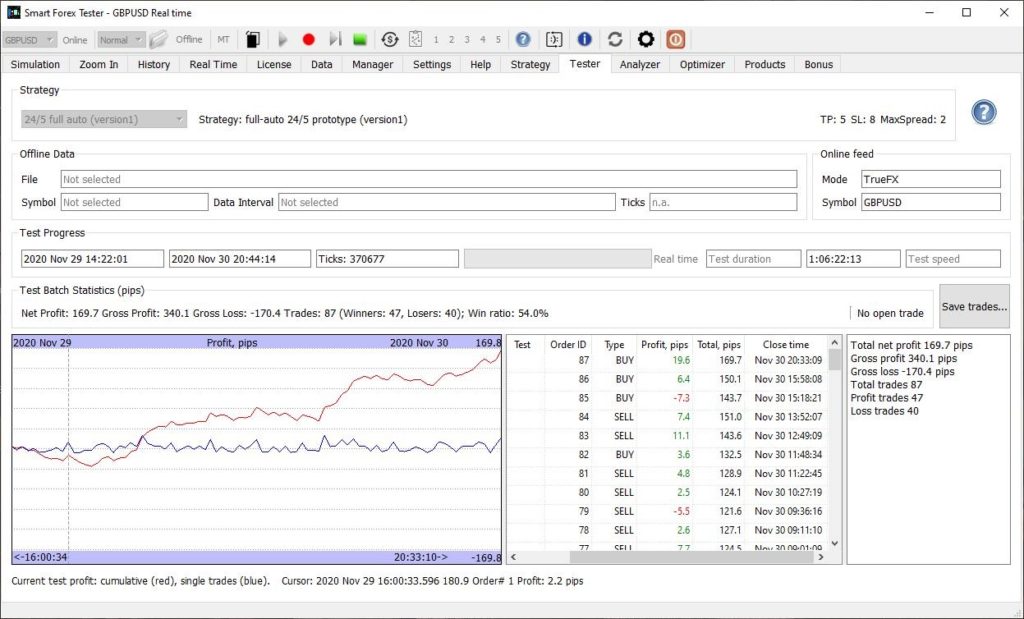
Here are the results for the first 2 trading days. Both days were profitable and the total profit was 170 pips.
Nice profit growth again. 170 pips profit and win ratio of 54% is better than usual.
Bottom line: yet another month our automated trading strategy showed stable profit growth, win ratio exceeding 50% and low draw-down. To achieve such good results, fast quote server connection with RTT around 100 ms was crucial.
In November, we continued testing our automated trader on GBPUSD data feed by TrueFX . Read our previous report for the details of how we did our testing.
Total result was excellent: over 1,000 pips gain. The first week alone gained 514 pips which was the best result, but all the other weeks were also successful – except for the last holiday week where we had a small loss of about 30 pips.
Importantly, at no time did we have big draw-downs; instead the profit was growing steadily and the win ratio was consistently above 50%. In other words, the profit didn’t depend on a small number of mega-trades, but resulted from multiple sequential wins instead.
What is even more important, the pattern mentioned was the same we observed in the previous months of testing. So, this can’t be a coincidence. It shows that our strategy can be trusted even in its prototype version. Which is encouraging.
In addition, we were analyzing how the trading results depend on the quality of the connection to the quote server. We noticed that always when the test machine had higher RTT, it received less ticks and the trading result was worse.
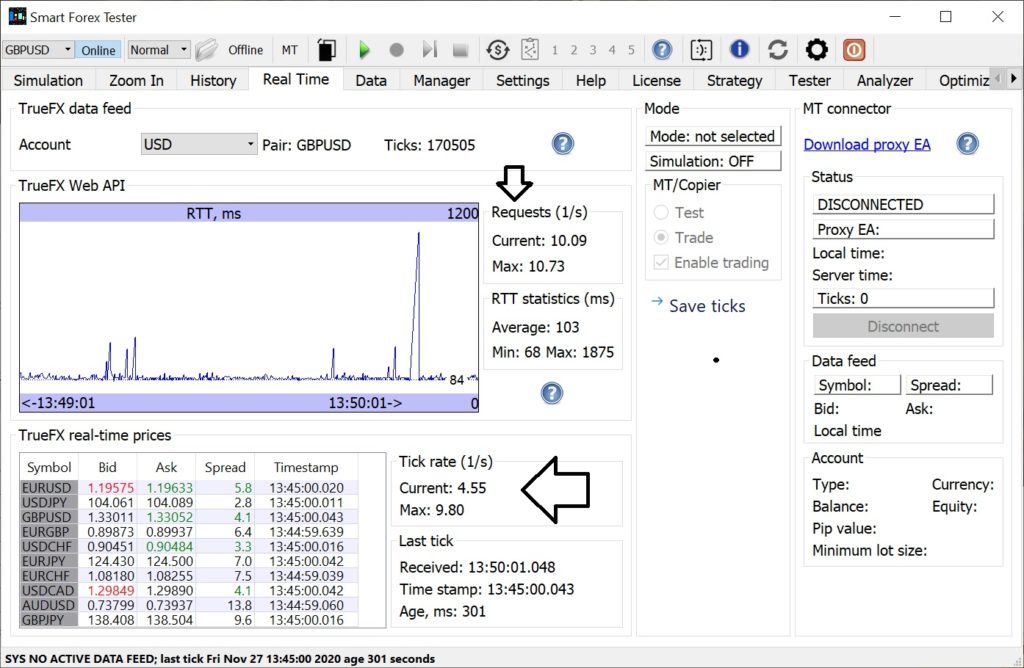
So, we added the functionality to monitor the server connection in the Smart Forex Tester GUI. The below picture shows a sample result from the last 12.5 trading hours in November.
Amazing: free TrueFX WebAPI provided steady rate of 8-10 requests per second and up to 9.8 ticks/s.
We see that the Tester received over 170K ticks – making the average rate ~3.8 ticks/s. This is higher than what we observed for the brokers we tested with.
But we also see that during the fast moving market we receive ticks even faster – the rate maxed at 9.8 ticks/s. And it is important to notice that the maximum API request rate was even greater – meaning that the server connection itself was not a bottleneck.
Note that the Tester sends API requests as fast as it can, but a request results in a new tick only if the server has an update.
Maximum rate of ~10 ticks/s is excellent. Especially for a free feed. Some providers charge hundreds of dollars a month for such feeds.
So, our testing showed the trader is clearly winning – when run on a high quality tick data feed. Unfortunately, you have to be an institution to trade on excellent TrueFX prices.
A very important next goal is to find a broker providing access to both high quality price feed and execution. So that we can fully realize the potential of our automated trader.
Another task is to improve the trading strategies, since those currently available in the software are only prototypes. With this in mind, the observed performance is amazing.
We have a lot of strategy ideas to implement. One thing we need to address first is to increase the realized win ratio. The tester steadily reports potential win ratio north of 70% – which means the market entries are way better executed than profit taking.
In addition, the version1 that we were testing with is more trend-oriented. With our win ratio of ~50% our profitability mostly resulted from trends. In other words, we win much more when the market was trending, than we lose during the range-bound markets.
Since the markets are range-bound almost 80% of the time, switching the trend-based strategy to the mean reversion based one should definitely increase win ratio.
We can do this simply on time basis: mean reversion should be active after the end of the New York session and at least until the Frankfurt open. Or maybe longer – since sometimes even the London session has a lot of seesawing in the first hour.
Despite small loss in the last trading week, overall in November our automated trader gained over 1,000 pips and again we observed the same winning pattern we noticed from our very first tests: win ratio exceeding 50% and low drawdown with no long sequence of loss trades.
The below graph shows the Thanksgiving week, where before the eve we were nicely up almost 90 pips.
Thanksgiving losses turned the the whole week slightly negative. But the win rate remained at 50%.
However, on the Thanksgiving eve we had unexpectedly many losing trades in a row. Which lead to overall week loss of about 30 pips. Though the win ratio didn’t go below 50% and 3 of 5 trading days were profitable. The full trade log.
Last time we recall this losing strike happen on September, 21. We will be analyzing the trades and adding this day to our set of negative scenarios for back testing.
Bottom line: low volatility resulted in sub-optimal trading performance. However the whole week was again profitable.
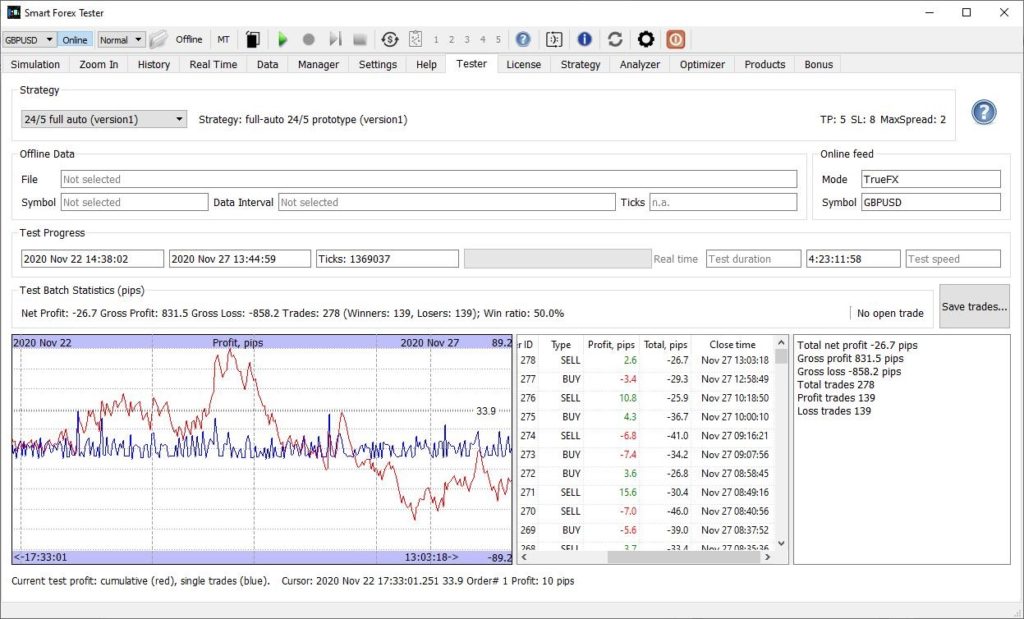
We continued our forward testing of our automated trading on real-time prices provided by TrueFX. All test parameters were unchanged since our first test.
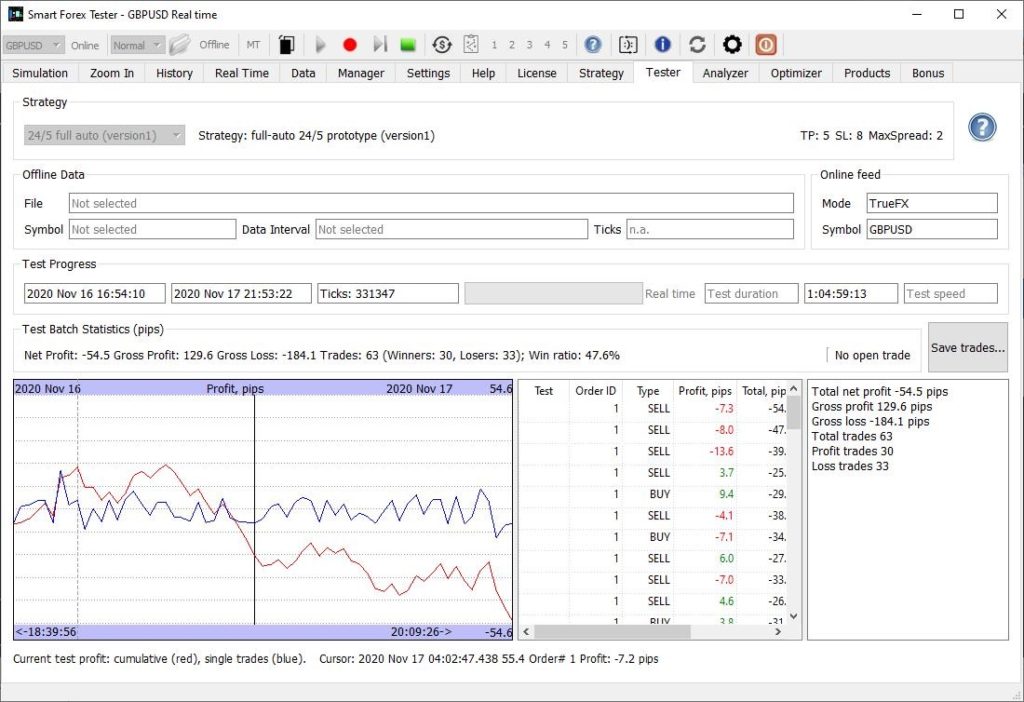
The first trading day of the week was the most successful. The strategy gained 160 pips in 24 hours.
The graph below shows the result from the beginning of the Auckland session on Sunday until the end of the US session on Monday.
The best 24 hours in the week. Steady growing profit and low drawdown. Win ratio 51%.
The next two days were losing days. However, in absolute numbers, the losses during these 2 days were considerably less than the win during the first day.
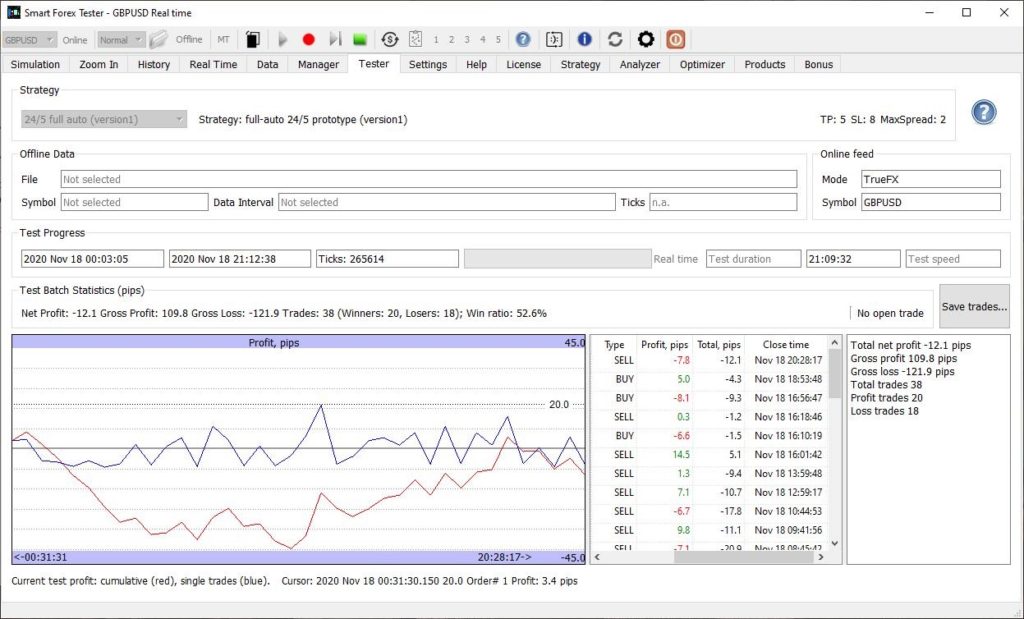
The results for Tuesday are on the below picture. Note we used the newer build so the interface is slightly different.
The worst day of the week. Win ratio only 48%. But losses are limited: only 55 pips.
We can see that losses are limited. In total, we are still nicely up. Trade log.
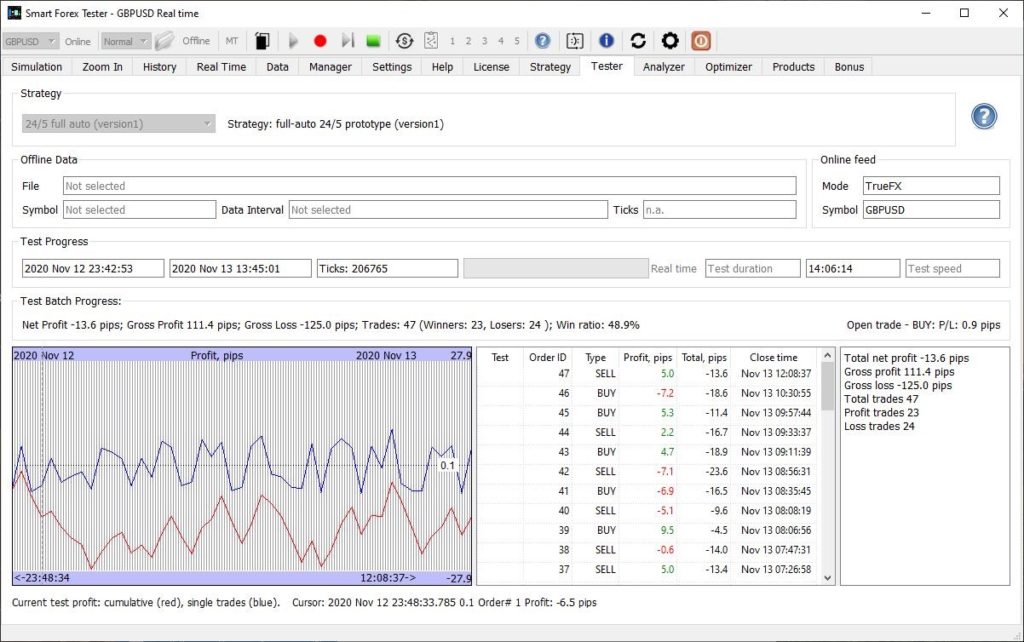
Wednesday was a very slow day. The results presented below.
Very slow trading day. Only 38 trades. Usual win ratio of 53%.
Again, small loss but we are still up almost 100 pips for the week. Trade log.
Thursday-Friday results are below.
Win ratio at 53% again and steady profit growth for low volatility market.
Thursday was a very successful day – we were gaining steadily and the result was over 100 pips – for volatility of only 86!
Friday was very slow day with volatility under 60 but still we were gaining about 20 pips in the middle of the US session. Though we failed to keep those gains and lost some pips in the end. Trade log.
Summing up, this week was not the best one. Half of the time the market was very slow with low volatility, especially on Friday. However, even in such conditions, our strategy managed to win – just shy of 200 pips, which is good for such trading conditions.
We already reported that in our comparative testing the machine with smaller RTT was showing better trading performance. We tried to explain the fact why faster connection and better hardware combination was losing. One of the ideas we had was that if we are sending the requests too fast, the quote server may start throttling.
In order to test this, we swapped the Internet connections. So, we connected the laptop to the router with a Gigabyte Ethernet cable and the desktop was connected via the 2.4 GHz WiFi link. Now, the laptop connection was almost 4 times faster (measured with Ookla speedtest).
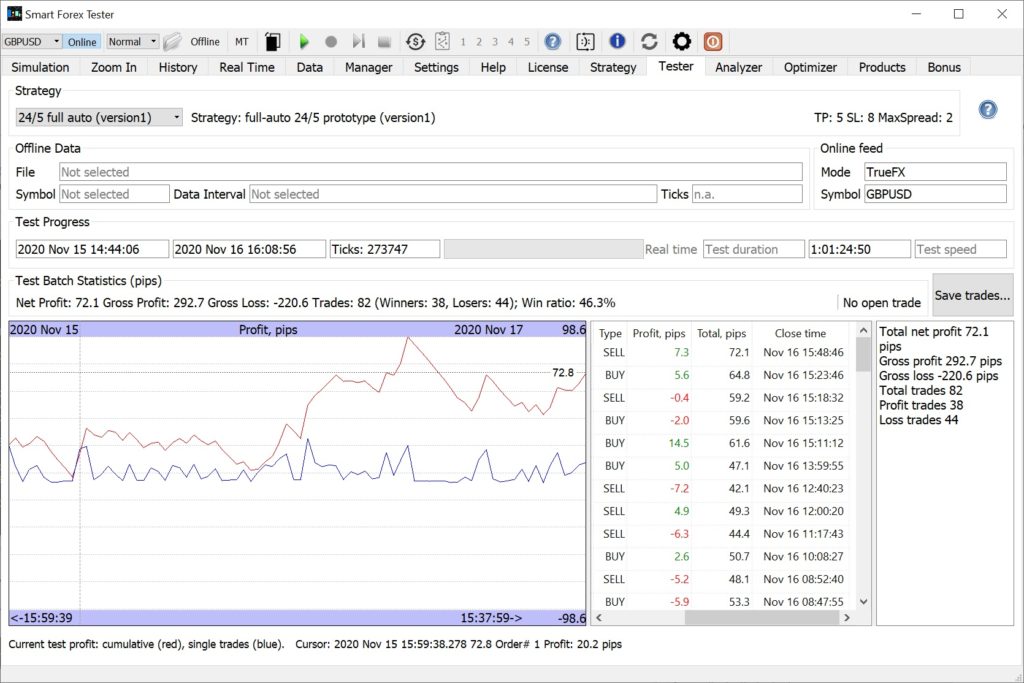
Here are the results. First, the desktop. In 25 hours test it gained decent 72 pips.
Moderate profit with low drawdown. Win ratio slightly worse than usual. Average RTT 129 ms.
Win ratio of 46% was a little bit less than we regularly observed, but still OK. Average RTT was 129 ms and we got nearly 274K ticks. Here is full trade log.
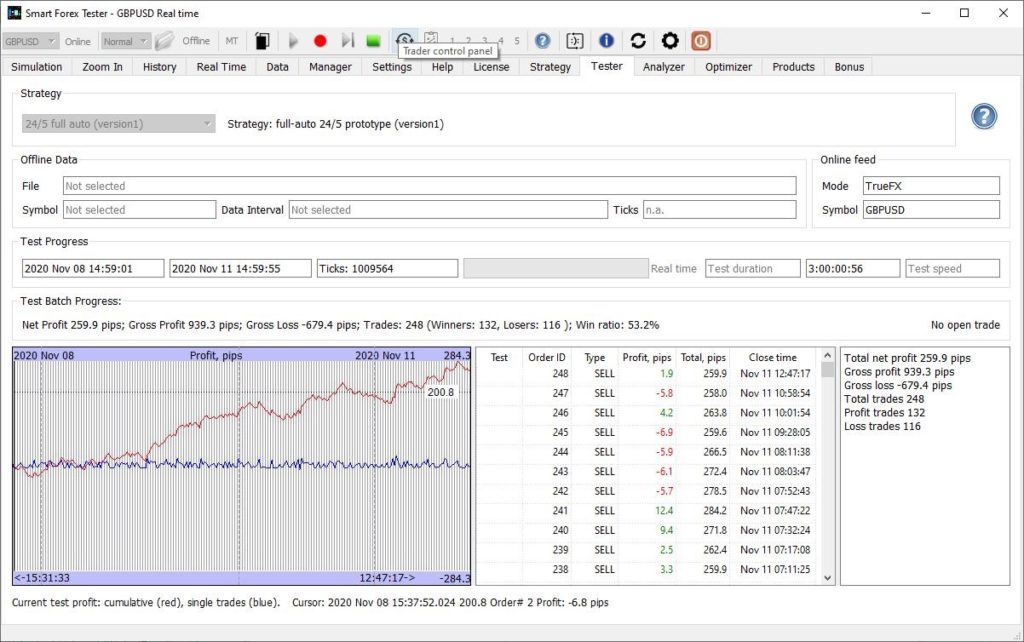
Now, the other test. High connection speed wasn’t a problem at all this time.
Average RTT 114 ms – 13% more ticks and much better everything: profit, win ratio, drawdown.
Lower average RTT and, correspondingly, 35K (or 13%) more ticks received seemed to help a lot. Profit more than doubled. Here’s full trade log.
So, our hypothesis was wrong – throttling was not at play here. We don’t yet know the real reason. It might be network drivers of antivirus software, among other factors. Again, this is not very important.
But it is important that we again got the confirmation that TrueFX data feed with lower RTT leads to steady good trading performance.
Apparently, RTT is one of the main important factors to pay attention to when using the software in copy trade mode.
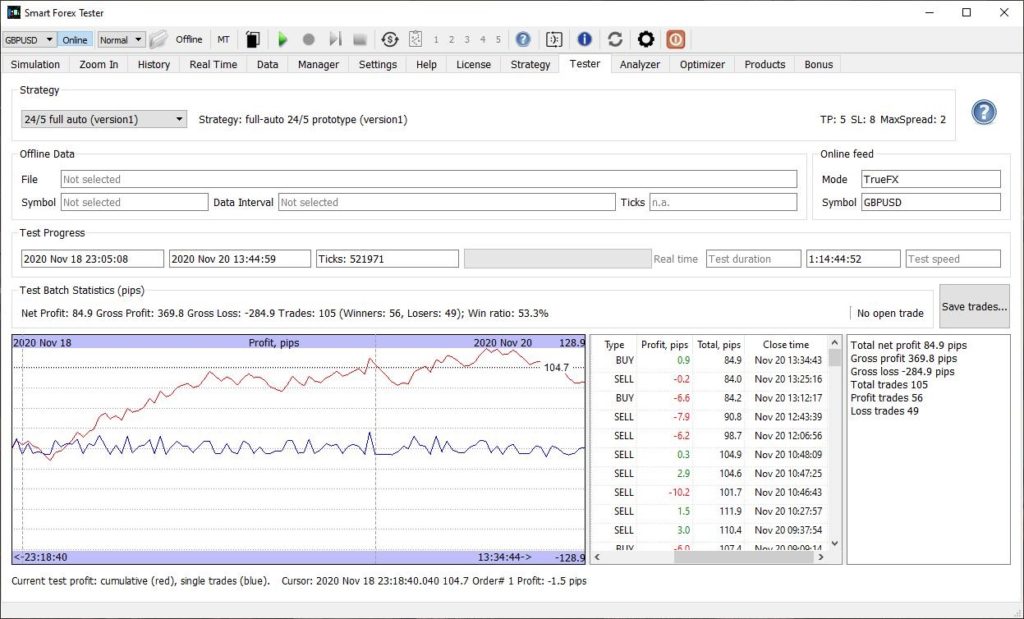
Another week of testing with the same strategy and parameters. And – same observations: over 350 pips profit, over 50% win ratio with minimum drawdown.
This week we were conducting some other testing, and we couldn’t capture the entire week test in one picture. Here is the first 3 days of testing – started on Sunday from the Sydney session.
First 3 trading days – same pattern: 260 pips profit. 53% win ratio. Minimal drawdown.
We can see that the test report again is in line with all our previous test results that you can find published on this blog.
Now, let’s take a look at Thursday’s result.
Another 135 pips gained on Thursday – note 53% win rate again, and small drawdown.
Very similar numbers that we have already got used to. Here is the trade log.
On Friday we had a small loss during low market volatility (~80 pip). Trade log.
Friday loss on low volatility market was quite small and we still had decent 49% win ratio.
Friday’s result is by no means negative. First of all, you just can’t win all the time in the markets – losses are part of the game. You need to minimize them. Which our strategy clearly did. In addition, we can be satisfied with both nearly 50% win ratio and small and smooth drawdown.
Bottom line: we observed that a mere 25% increase in the round-trip time (RTT) to the TrueFX quote server resulted in considerable deterioration of the trading performance – for the same software, the strategy and its parameters.
In our previous post, we came to the conclusion that the 15% loss of ticks on the machine where the Smart Forex Tester software was run from the IDE – compared with the reference test – was caused by lower performance of the IDE version in handling HTTP requests to the TrueFX quote server.
While it is a known fact that the software run from the IDE is less optimized, we found that there are other factors at play that may better explain the difference.
We repeated our previous test – this time using the release version on both computers. The idea was to eliminate the alleged performance gap and thus minimize the difference between the number of received ticks.
Both computers had similar hardware and the Internet connections on both machines were more than adequate for the purposes of the test.
Both machines were connected to the same router. The reference setup was connected via a 2.4GHz WiFi link (Ookla speedtest: 45/5 Mbps), and the other machine had a Gigabit Ethernet connection (Ookla speedtest: 180/5 Mbps).
The below graph presents the test results for the reference setup.
GBPUSD test lost 14 pips during Friday session with low volatility of 88 pips. Times PST.
Despite a small loss, we can be satisfied with this result – which was achieved during low market volatility period. And overall, this loss was a drop in the bucket – the whole week remained solidly profitable. During the first four weekdays, our automated strategy gained just shy of 400 pips.
So, this Friday’s result is also coming in line with our previous observations that about 80% of trading sessions are profitable. Win ratio was also decent.
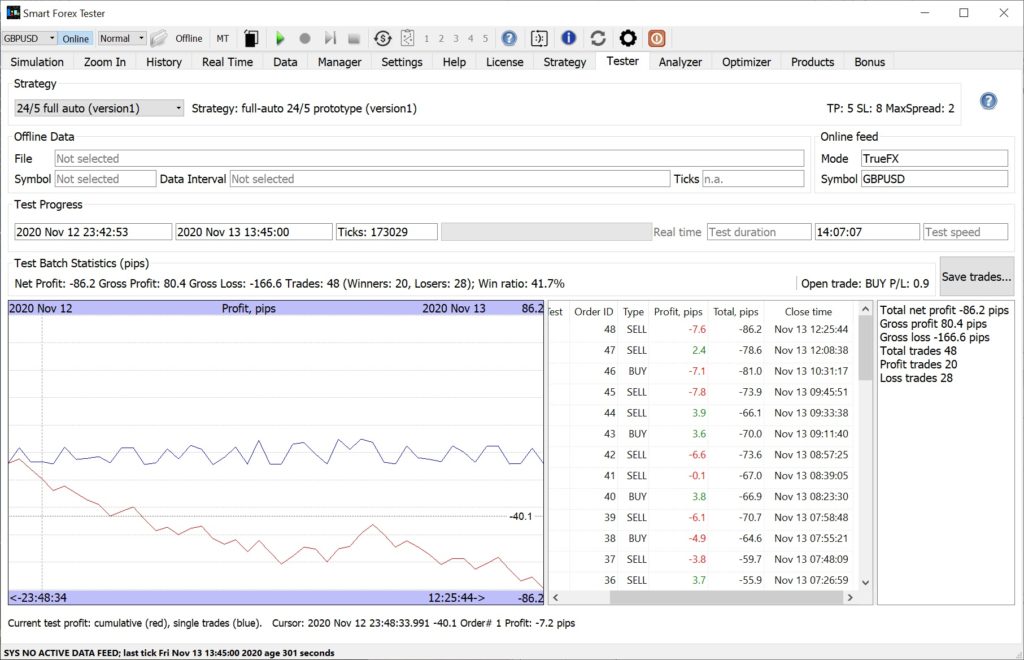
However, the other test went much worse than the reference one.
Same software. Same hardware. 4 times faster Internet connection. RTT increased 25% – the culprit.
At first glance, this result defies all logic. After all, we were using the release software this time, not the IDE. And the machine we ran it on has slightly better hardware – plus 4 times faster wired Internet connection than the reference setup.
After a quick investigation, we noticed that for some – yet unknown – reason, average RTT to the quote server was 25% more than that on the reference setup. Check the values marked by arrows on the below graph.
The setup with smaller RTT had more ticks and better trading performance.
For the reference setup, the RTT – averaged for this 14 hours test – was 115 ms. But for a more powerful machine with a much faster Internet connection RTT was 145 ms. Now, the test result suddenly started making a lot more sense.
We will have to investigate the reason why the RTT for a more powerful setup was actually worse. But this is not the most important here.
What really matters here is that our latest results actually confirmed the conclusions of our previous test: slightly less ticks – considerably less accurate signals.
So, it appears that to properly utilize the perfect (and free!) TrueFX live feed for live trading, we should consider implementing a 2-tier structure.
First, we have to make sure the software is run in the environment with the smallest possible RTT: less than 100ms should be good, and less than 50 – ideal. RTT this low will guarantee the best possible trading signals. Arranging a VPS physically close to the TrueFX server location is the way to achieve that.
Next, once a signal is generated, we can probably afford a reasonable (200-300 ms) delay for the trades’ execution: relying on the fact that in many cases, the market may see-saw a bit.
We already mentioned that our tests showed that our strategy is consistently profitable when tested on TrueFX live price feed. And we noticed that one reason for this is much higher tick data rate that TrueFX provides – compared to the feeds from all other brokers that we tested with.
Today we compared the trading performance for 2 different environments – and both were using the TrueFX live feed for GBPUSD.
The other setup was our development environment (IDE). So, it was less optimized than the release version. The IDE machine is a little bit more powerful than the laptop – this is the only thing we need to know hardware-wise. Both machines were connected to the same router.
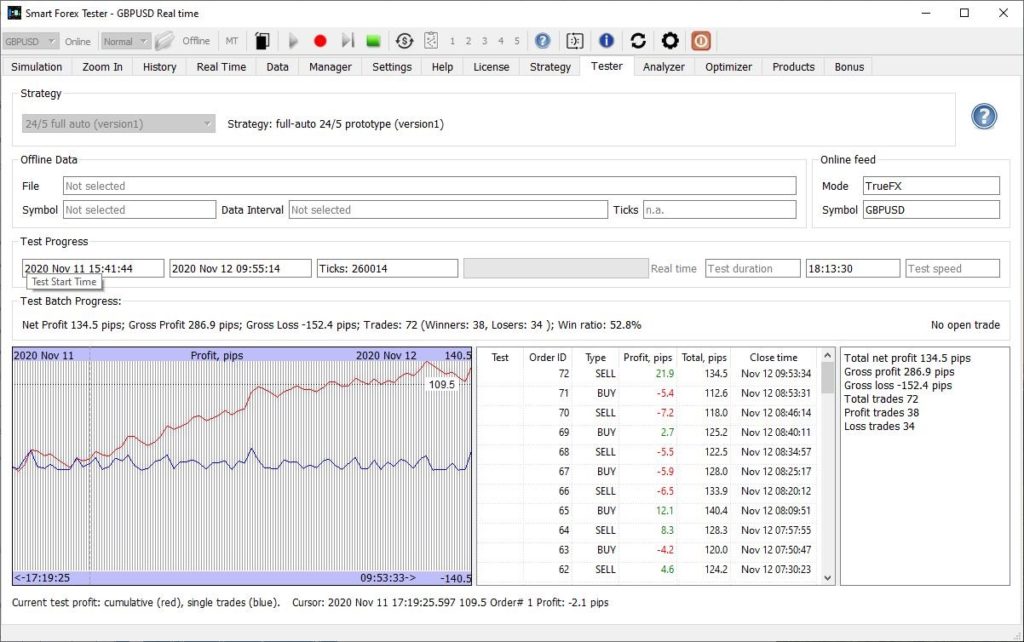
We started both tests simultaneously about 40 minutes into Sydney trading session on November, 11 and kept it running for 18 hours – through all UK session and half of the US session on November, 12.
The graph below shows the results from the test run with the release version.
Release version gained 135 pips in 18 hours. Win ratio was 53%. Time is PST.
We can gladly notice that the performance was again (!) in line with the test results that we have been getting for last couple of month. Same healthy win ratio and low drawdown.
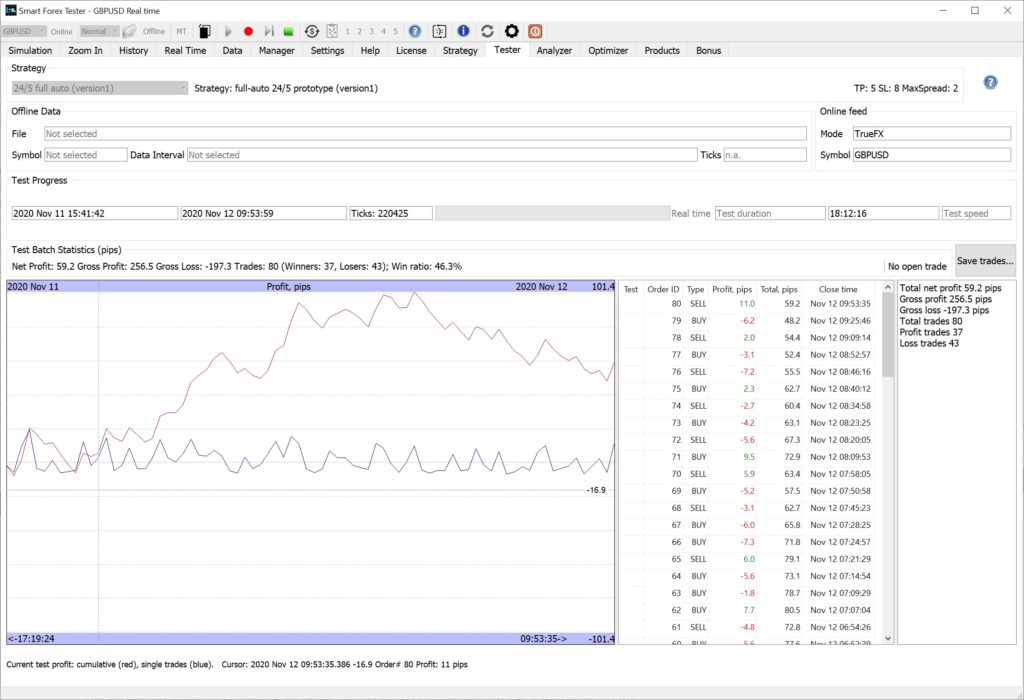
Now, let’s check the results of the test that was run from the IDE. The software in this test is essentially the same as the release. We did implement some improvements, but they don’t affect performance anyhow – while the trading strategy itself and all other trading related code remained unchanged.
Same software run from IDE delivered only about half the profit and only 46% win ratio. Time PST.
We see that while the results are not bad at all in absolute terms, they pale in comparison with the reference test. Why do we have this difference?
What we observed was that before the European session started, in slow Asian trading the results match almost 100%. Thus additionally verifying the fact that both softwares works the same.
However, once the market started moving fast in the European session, the results started to differ. And we noticed that the IDE version received ~40K ticks (or 15%) less than the reference release version.
The reason for this difference is clear – less optimized code was not able to handle the same number of quote requests to the TrueFX server.
We can say that 40K is relatively big number. From our experience, from some brokers we could get even less than that – in total!
So, this test confirms our observation we did from the very beginning of testing. Namely, live price feed quality is essential for the success of the strategy.
And we now see that even for the feed that is known to work very well, we can get deteriorated trading performance if parts of ticks are not received.