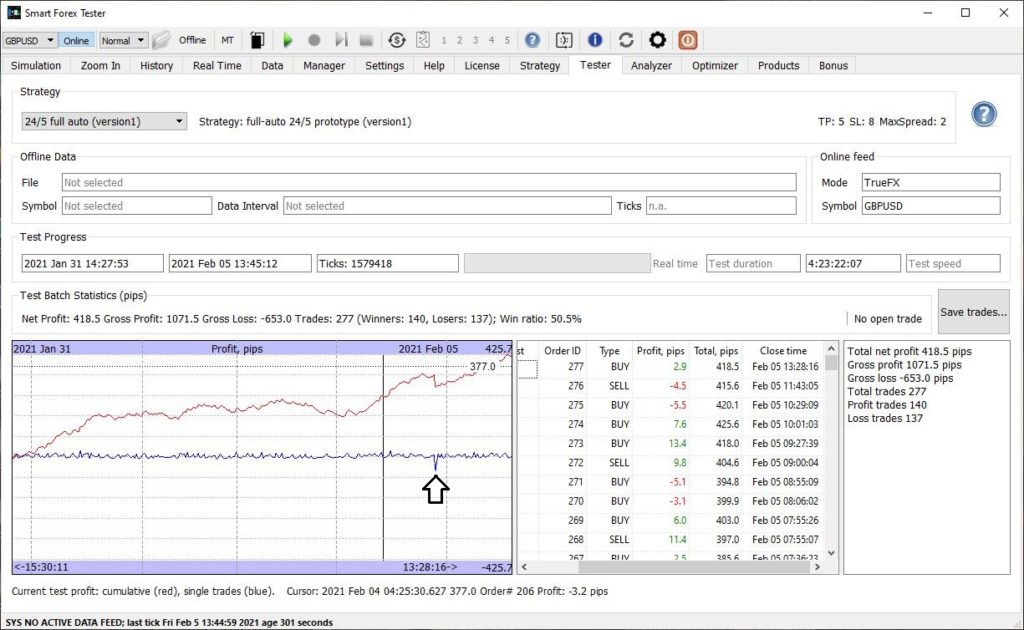
In the beginning of February we again had a familiar pattern that we observed during the end of 2020. Our automated strategy delivered 50.4% win ratio and steady profit growth without big drawdowns.
The weekly profit was double the volatility (193 pips).
Marked by arrow is 50 pips loss trade due to spread jump in the end of NY session
A curious event happened on Thursday. Usually spreads widen drastically after the New York trading session ends. This time the spread increase was so big and happened instantly, so the strategy could not close the open trade with the standard SL of 8 pips. Instead, the loss for this single trade was 50 pips.
However, this is a known issue with the current prototype strategy which doesn’t have any scheduler and since we keep our test on 24/5, every day there is a risk of such losses.
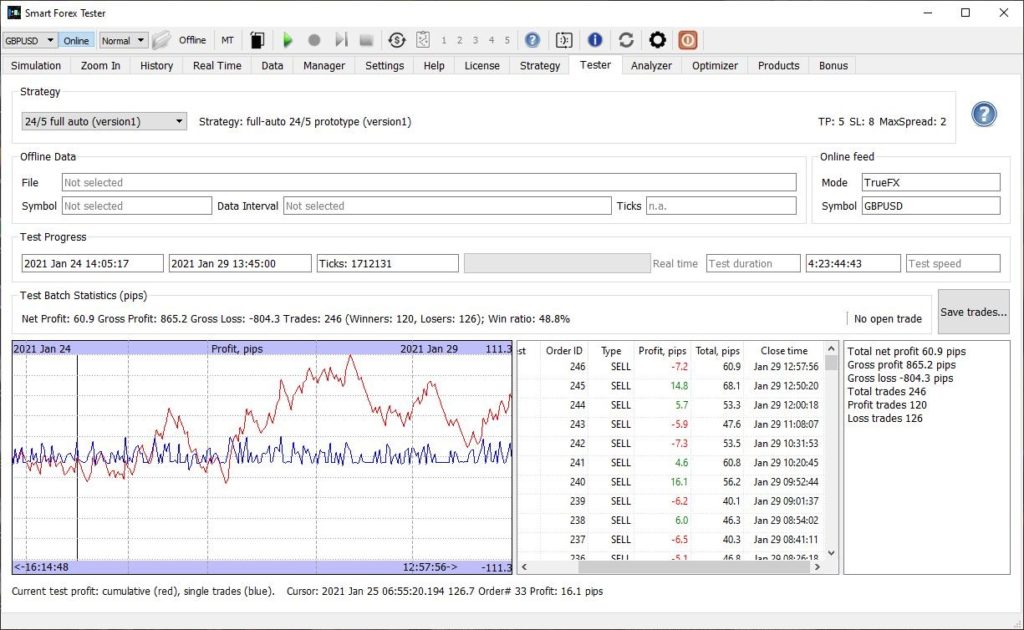
During the last week of January GBPUSD turned out even less volatile than during the previous one – only 150 pips.
This is the lowest volatility we have observed for this pair during our non-stop forward testing of our automated trader on GBPUSD on the TrueFX data feed.
But despite the “dead” markets, our trader did well and as a result this week concluded another profitable month – already 4th in a row.
60 pips weekly profit is an excellent result for low volatility of 150 pips.
With volatility that low, our strategy could not deliver very smooth equity curve as it did many times before. However, maximum drawdown was reasonable – around 50 pips.
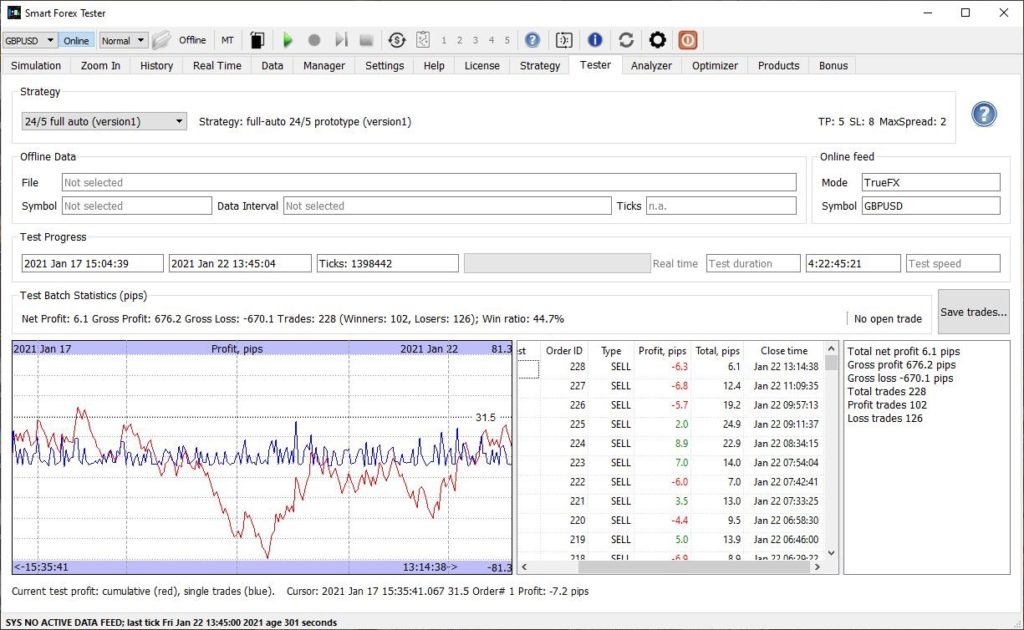
There is not much to say this week. Volatility in GBPUSD was low (230 pips). This is one of lowest values for this pair that we observed during our test where we have been running our automated trader on TrueFX data feed for 4+ month in a row.
Here is the weekly equity curve.
Despite awful Tuesday session, overall weekly result is again positive.
Tuesday was a very bad day with over 100 pips drawdown, which contributed a lot to the lowest on record win ratio (45%).
Still, the rest of the time our strategy fared better and managed to recover losses – so, the week became yet another positive one, albeit symbolically.
It is really reassuring to see that our automated strategy could tolerate such low win ratio. We used to have it slightly over 50%. This once again stresses the importance of elaborating our version1 which is more trend-oriented. We need to enhance the algorithm to use mean reversion for the range-bound markets.
This is easier said than done, of course – but we are working on it.
We have been systematically testing our automated trader since October. On the same currency pair and also keeping the trader parameters the same.
The first two trading days’ results are shown below. Here is the full trade log.
Worst win ratio in our long test. The result still good.
The volatility in this part of the test was 187 pips. Monday was a fabulous day with over 100 pips profit and nice equity curve.
But from the second half of the London session on Tuesday, the strategy had one of the worst losing streaks we recall and gave back almost half of the 160 pips gain it had made from the beginning of the test.
Due to a technical glitch in our system, the test stopped in the second half of the NY session. We restarted it couple hours before Frankfurt open.
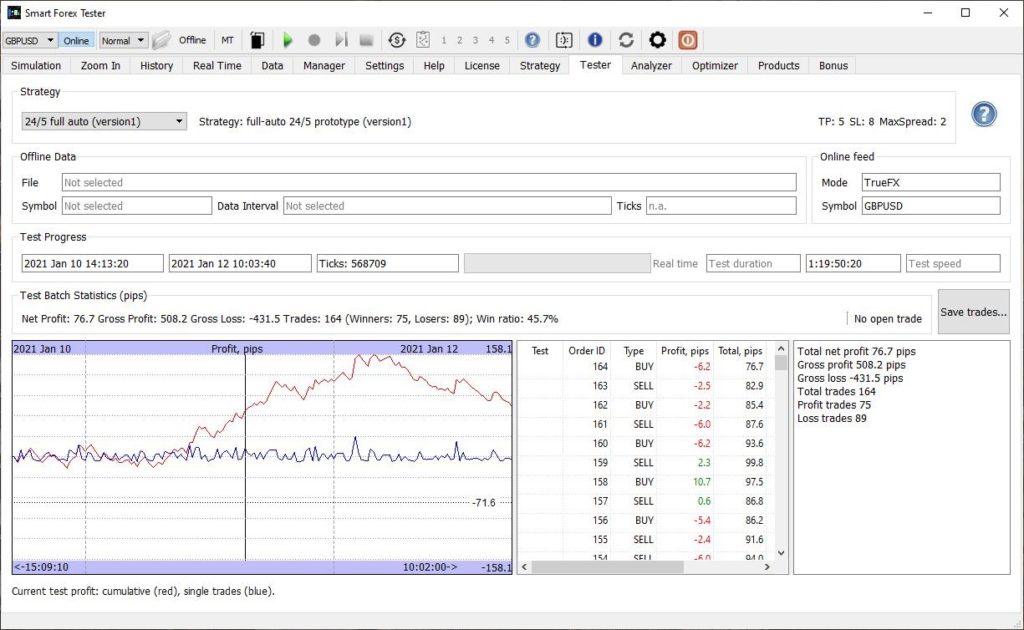
The results from the restart until or the rest of the week are as follows:
Nice win ratio and decent profit for low 137 pips volatility.
In the second part of the week (Wednesday-Friday), the GBPUSD volatility was considerably lower than usual – only 137 pips – and essentially all of it on Thursday. The strategy nicely used this and scored almost 100 pips. The rest of the days the market went nowhere. Here is the trade log.
Bottom line, the week profit was 140 pips. In fairness, we have to mention that we had a 8 hour gap in the second half of the NY session and the first half of the Asian session.
But since it is extremely unlikely that we would have lost over 100 pips in a slow Asian trading, we can safely say that the week was again profitable.
We continued our non-stop testing of our automated trader when the market reopened in 2021. See the details how we test here.
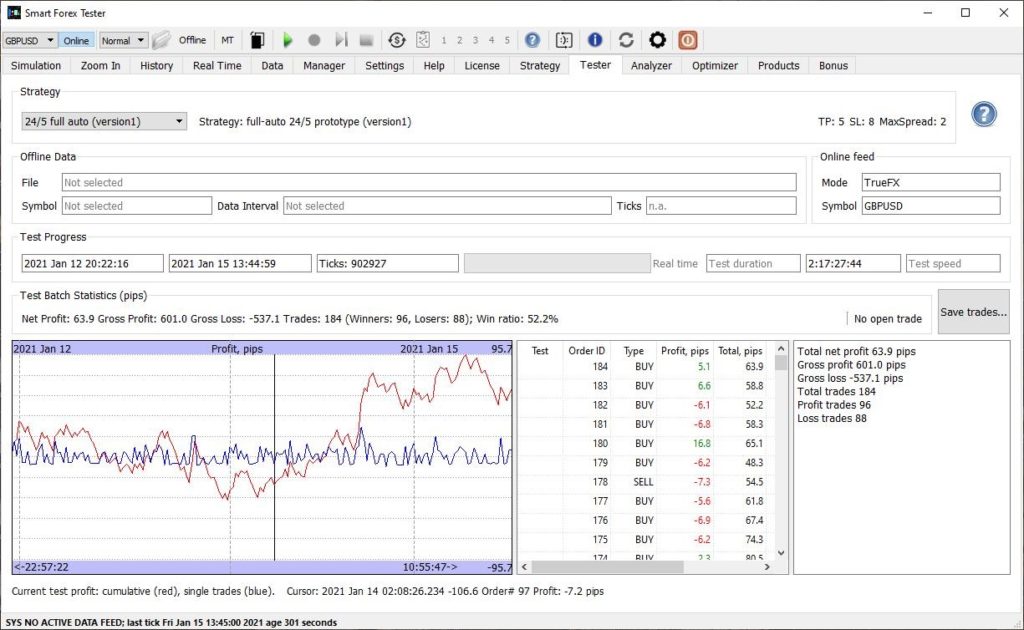
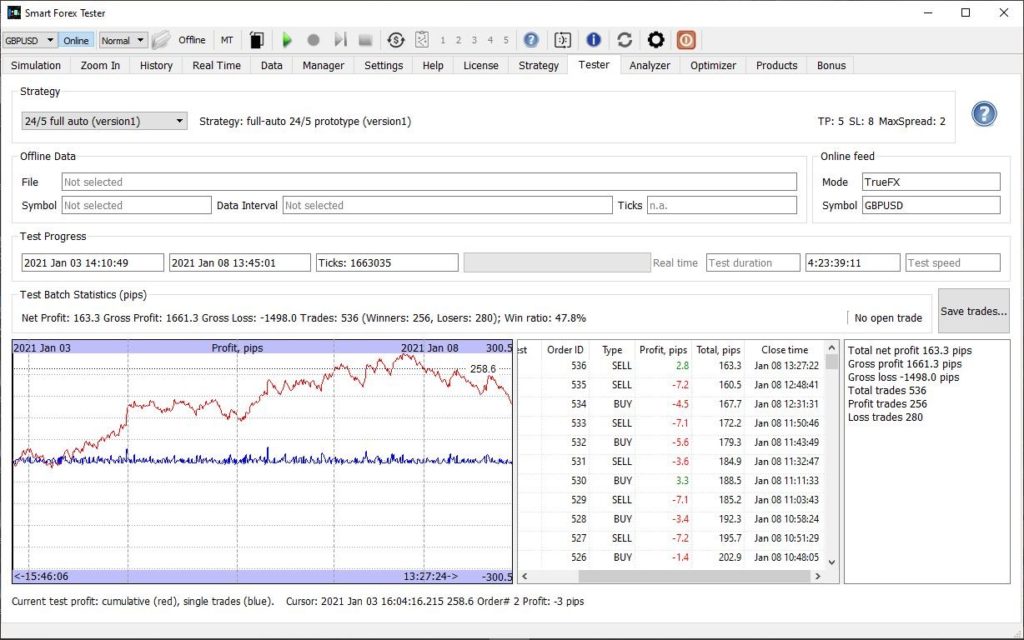
The first trading week of 2021 was nothing spectacular. But still, our automated trading strategy delivered 163 pips of profit.
Despite the loss on Friday, the week was again profitable
If you want to check the details, here is the full trade log.
The week volatility was 174 pips, which is rather low for the GBPUSD pair. For example, in the last week of 2020 it was twice bigger.
Apparently, this low volatility resulted in lower than usual win ratio (48%) since our strategy is trend-oriented and may have sub-par efficacy in the choppy sideways market.
However, the equity curve was usually smooth – except for Friday.
Bottom line – even though lackluster compared to many others, the week was profitable again – and this is what really matters.
We have been documenting the results systematically since late September and they have been just phenomenal. Check our previous blog posts for more details.
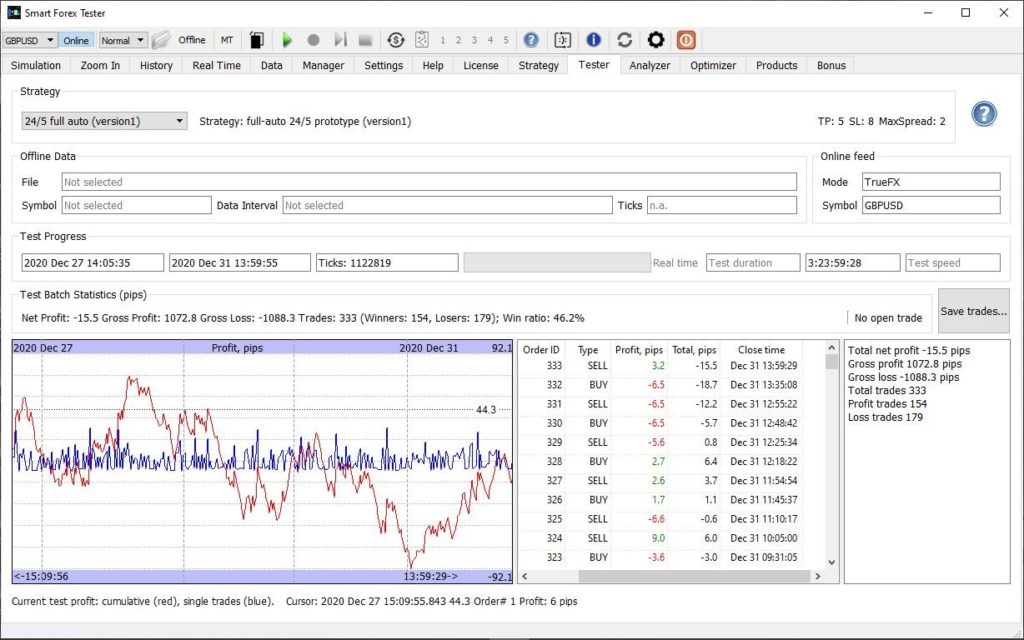
It was expected that the New Year week would be slow. But our goal is to gather as much test data as possible for the test to be statistically more significant. So, we kept our test running until the end of 2020 trading. (see how we test)
And even is the thin holiday trading, our strategy fared quite well.
Despite bigger draw-down intervals than usual, the test result is decent
We see that the equity curve is much more choppy than usual, and the win ratio dropped to 46.2%. But despite that, in total the strategy was only down 15 pips.
In our view, this is a positive result. It could have been much worse in these market conditions.
If you want more details, here is the full trade log.
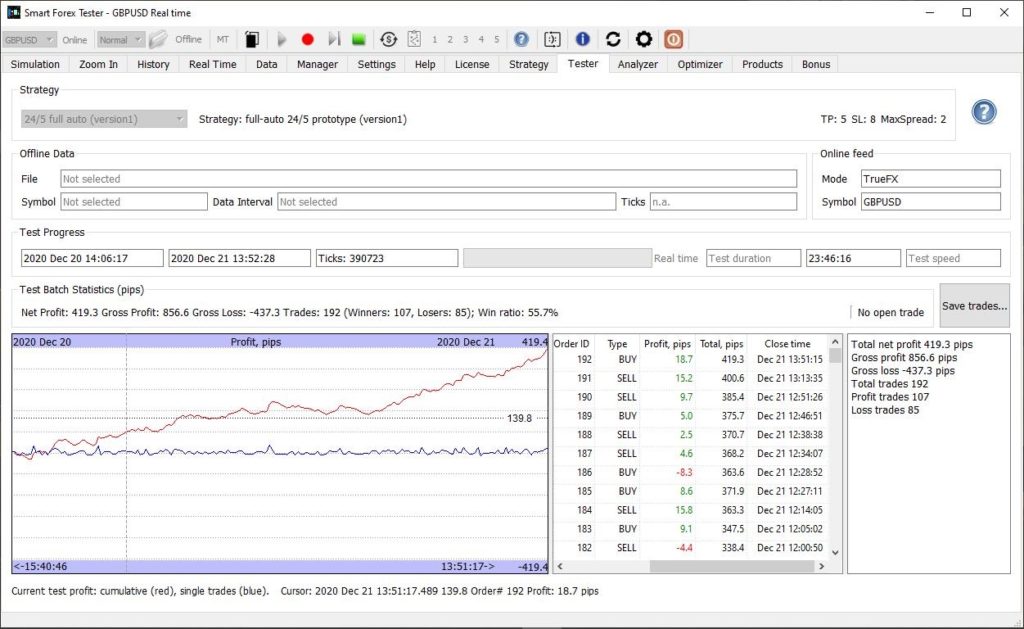
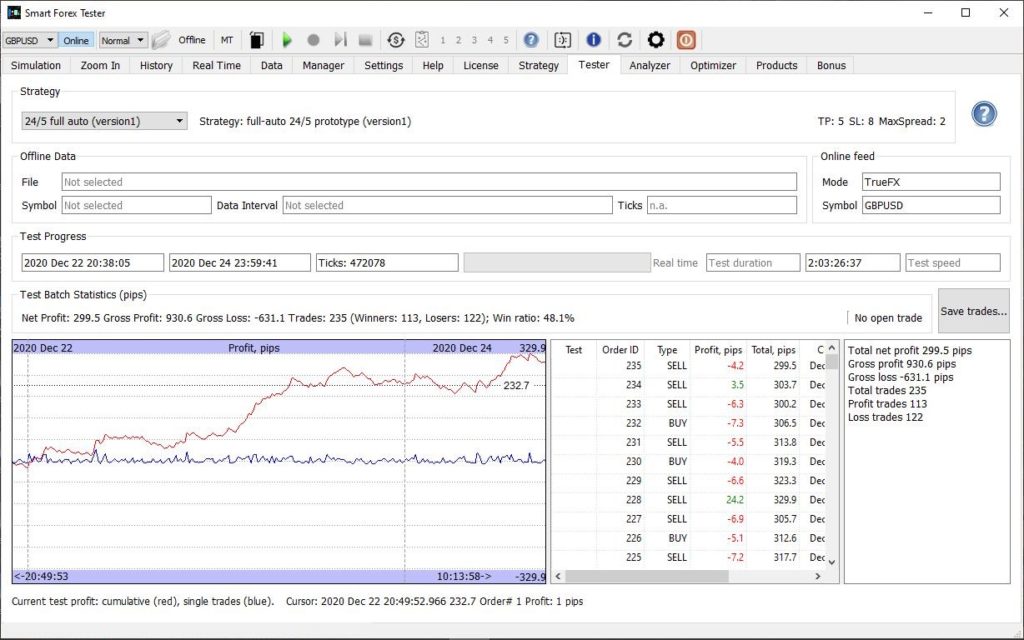
December 21 was a very volatile trading day (360 pips) – apparently the Brexit trade deal deadline influenced a lot.
Our algorithmic trader excelled in this environment, making more 419 pips.
Volatility 360 pips resulted in 419 pips profit and 55% win ratio.
If you want more details, download the full trade log for December 20-21.
Also, if you just found our blog: for the 3rd month in a row we have been testing our automated trader software on the real-time GBPUSD data feed by TrueFX. You may want to check the details how we are testing.
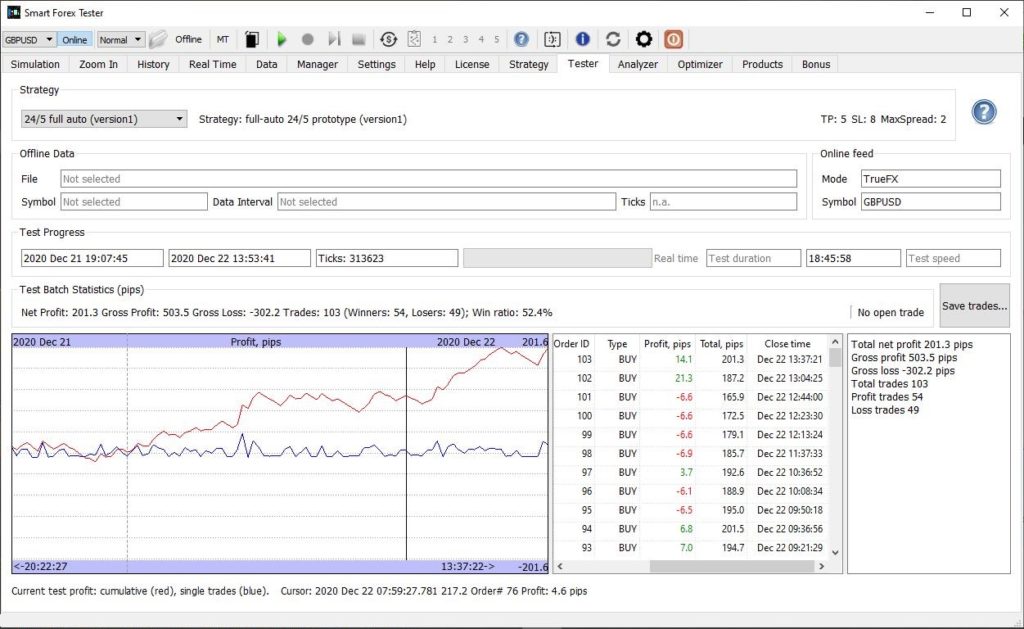
The rest of the shortened Christmas trading week also left very little to be desired. The next day our trader took 201 pip profit.
Bottom line, the short Christmas trading week yielded great total profit of 919 pips. This is almost the same as we got for the whole month of November.
And again, the most important was stability: very steady profit growths without big draw-downs with every single trading day profitable.
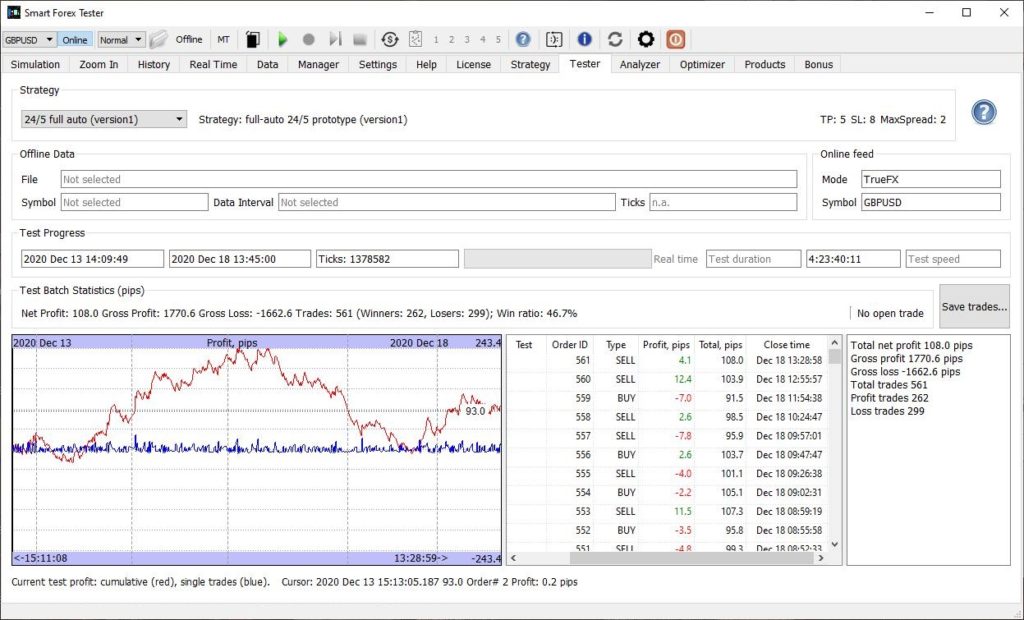
The trading week of December 13-18 was not easy for our automated trader. December 16 was one of the worst days in our 3 month test: we lost over 100 pips. Last time we had a loss like this was September, 21.
Over 100 pips loss Dec 16. Two losing days in a row. But still up 100 pips for the whole week.
However, despite one more losing day afterwards, the whole week was again profitable – 108 pips.
And since the beginning of December, was 1160 pips. This is just shy of the result for the whole month of November.
If you are interested in the details, here is the full trade log.
And if you are new to our blog, read our report for the details of our several month long test of our automated trader software on the real-time GBPUSD data feed by TrueFX.
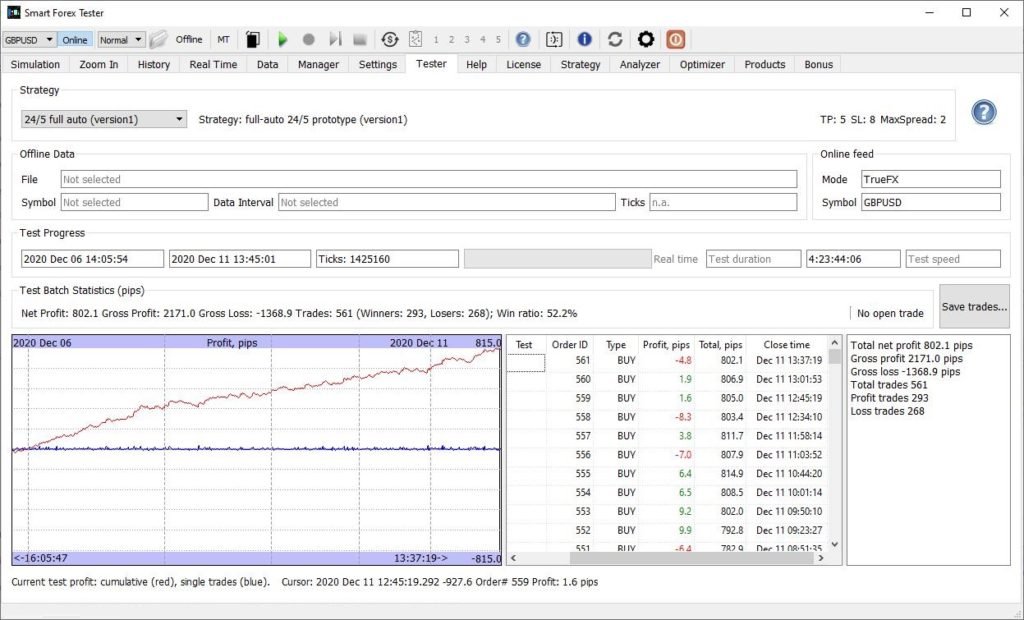
Trading week of December 6-11 was a great success. Our automated trader won 802 pips, which is almost the same that we gained during the whole November.
And again, the most important was how this profit was achieved: smooth growth with low draw-down and no losing days. Win ratio was again stable at 52%.
If you didn’t read our blog before, we have been testing our automated trader software on the real-time GBPUSD data feed by TrueFX. For the details how we are testing, read our previous report.
Here are the weekly results. Total profit was 802 pips.
Stability again. Up 802 pips with 52% win ratio, low draw-down and no losing days.
And if you want to dig deeper, here’s the full trade log.
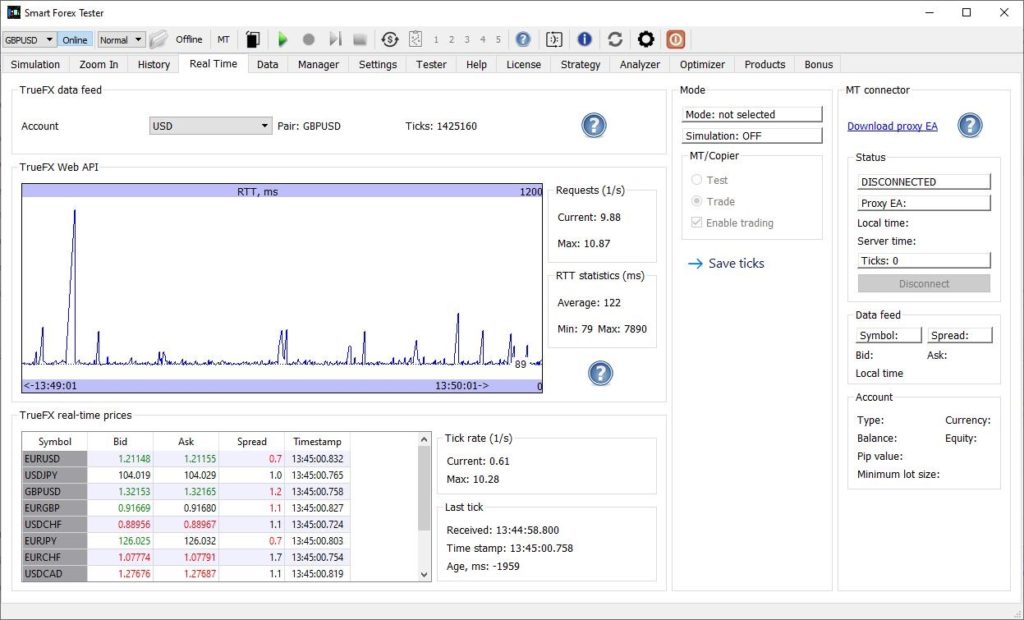
Another important thing we wanted to discuss is the quote server communication.
In this test, we use the free WebAPI provided by TrueFX. The Trader sends the API requests as fast as it can, and gets a new tick in the response every time the server has a new quote.
The software monitors the API request rate, and RTT to the server. See the screenshot below.
At maximum, we got over 10 ticks per second. Ping to the quote server averaged 12 ms and RTT 122 ms.
We see that the maximum request rate was about 10 requests/s. With the average RTT of 122 ms, it makes full sense: 10 requests requires 10 round-trips. And maximum tick rate was in line, being just a little less than the request rate.
For our test system, the average ping to the server was 12 ms. For another system with the ping of 2 ms, we managed to get average RTT of 15 ms – and max API request rate increased a lot – to just shy of 100 1/s.
However, for the system capable of 100 API requests/s, the maximum tick rate was only about 30 1/s. Which appears to be the maximum possible for the free WebAPI. And a very high value as such.
In yet another test setup with RTT of 150ms the maximum rates were about 5. Still, we didn’t observe the trading performance deterioration in the said test.
We will continue monitoring the influence of the tick rate on the results.